Filters: Tags: Maui (X)
181 results (70ms)|
Filters
Date Range
Extensions
Types Contacts
Categories Tag Types
|
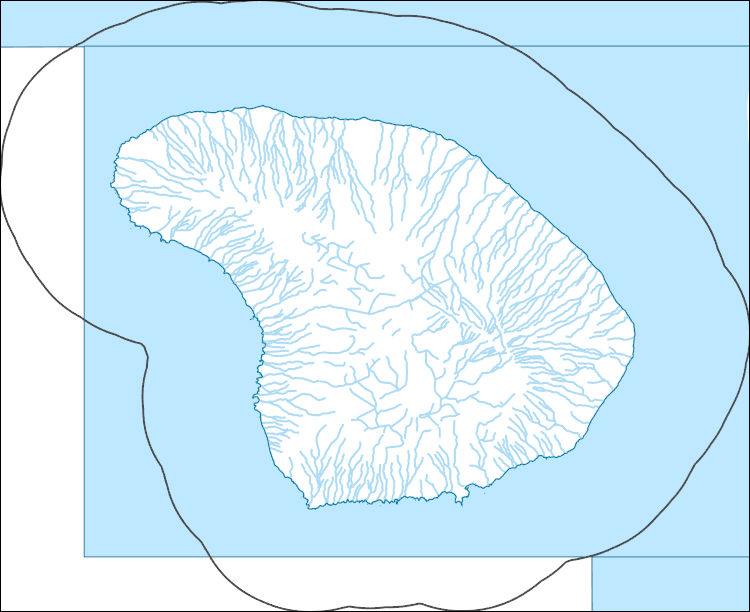
This shapefile is the official boundary of the Hawaii Fish Habitat Partnership. The shapefile was developed in 2013 to reflect the boundary as defined by the Hawaii Fish Habitat Partnership, a recognized Fish Habitat Partnership (FHP) of the National Fish Habitat Partnership.
Categories: Data;
Types: ArcGIS REST Map Service,
ArcGIS Service Definition,
Downloadable,
Map Service;
Tags: Analytical boundary,
Aquatic habitats,
Boundaries,
FHP Boundary,
FHP Product,
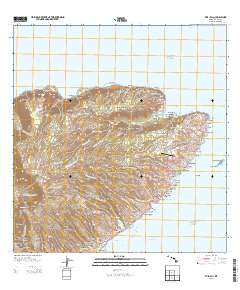
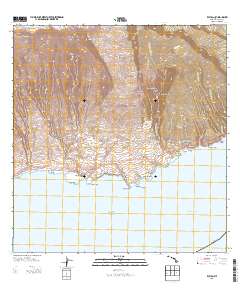
Layered GeoPDF 7.5 Minute Quadrangle Map. Layers of geospatial data include orthoimagery, roads, grids, geographic names, elevation contours, hydrography, and other selected map features.
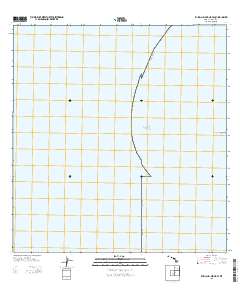
Layered GeoPDF 7.5 Minute Quadrangle Map. Layers of geospatial data include orthoimagery, roads, grids, geographic names, elevation contours, hydrography, and other selected map features.
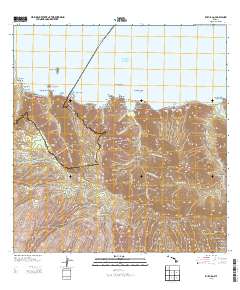
Layered GeoPDF 7.5 Minute Quadrangle Map. Layers of geospatial data include orthoimagery, roads, grids, geographic names, elevation contours, hydrography, and other selected map features.
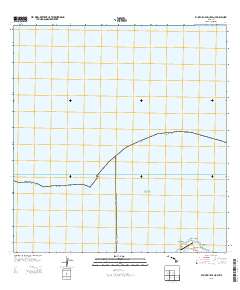
Layered GeoPDF 7.5 Minute Quadrangle Map. Layers of geospatial data include orthoimagery, roads, grids, geographic names, elevation contours, hydrography, and other selected map features.
Layered GeoPDF 7.5 Minute Quadrangle Map. Layers of geospatial data include orthoimagery, roads, grids, geographic names, elevation contours, hydrography, and other selected map features.
The U.S. Geological Survey (USGS), in cooperation with the State of Hawaiʻi Department of Transportation, estimated flood magnitudes for the 50-, 20-, 10-, 4-, 2-, 1-, 0.5-, and 0.2-percent annual exceedance probabilities (AEP) for unregulated streamgages in Kauaʻi, Oʻahu, Molokaʻi, Maui, and Hawaiʻi, State of Hawaiʻi, using data through water year 2020. Regression equations which can be used to estimate flood magnitude and associated frequency at ungaged streams were developed. The methods and results of the study are published in a separate report (https://doi.org/10.3133/sir20235014). This data release contains (1) a folder with the PeakFQ output files for each streamgage, ".PRT" and ".EXP" files, for use in...
Types: Map Service,
OGC WFS Layer,
OGC WMS Layer,
OGC WMS Service;
Tags: Hawaii,
Hawaii Island,
Kauai,
Maui,
Molokai,
Fog has been demonstrated to support plant growth, survival and ecosystem maintenance spanning rainfall and elevation gradients across the world. Persistent fog and strong winds on high mountain slopes in Hawaiʻi create a unique ecological environment. We collected stem and basal diameter measurements of three native plant species at Nakula Natural Area Reserve, Maui, from 2016-2019 and numerous environmental variables to examine how rain, fog and soil moisture influence plant water deficit and growth.
Categories: Data;
Tags: Maui,
Maui County,
Nakula Natural Area Reserve,
cloud water interception,
dendrometer,
The National Hydrography Dataset (NHD) is a feature-based database that interconnects and uniquely identifies the stream segments or reaches that make up the nation's surface water drainage system. NHD data was originally developed at 1:100,000-scale and exists at that scale for the whole country. This high-resolution NHD, generally developed at 1:24,000/1:12,000 scale, adds detail to the original 1:100,000-scale NHD. (Data for Alaska, Puerto Rico and the Virgin Islands was developed at high-resolution, not 1:100,000 scale.) Local resolution NHD is being developed where partners and data exist. The NHD contains reach codes for networked features, flow direction, names, and centerline representations for areal water...
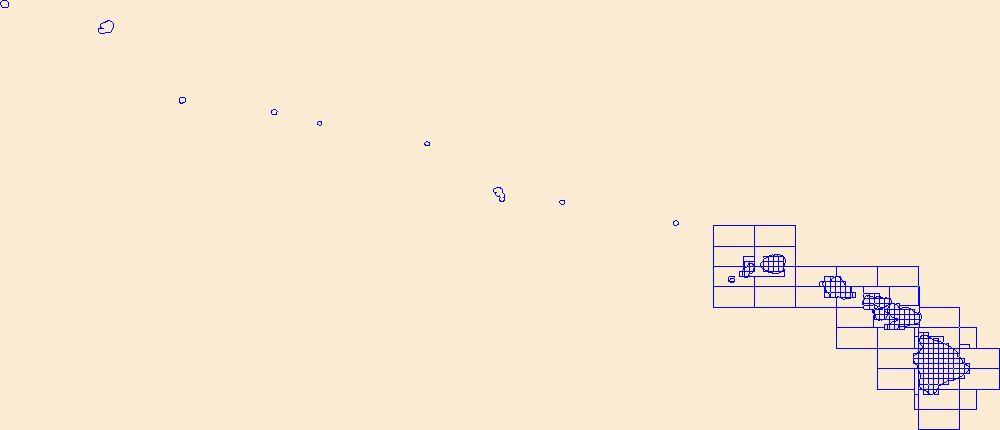
This data represents the map extent for current and historical USGS topographic maps for the United States and Territories, including 1 X 2 Degree, 1 X 1 Degree, 30 X 60 Minute, 15 X 15 Minute, 7.5 X 7.5 Minute, and 3.75 X 3.75 Minute. The grid was generated using ESRI ArcInfo GIS software.
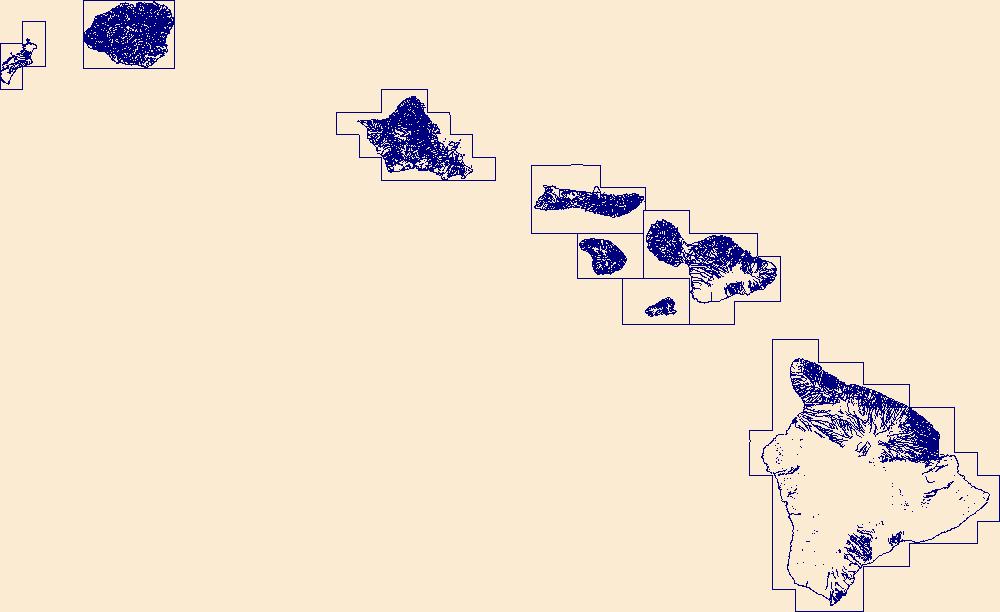
The National Hydrography Dataset (NHD) is a feature-based database that interconnects and uniquely identifies the stream segments or reaches that make up the nation's surface water drainage system. NHD data was originally developed at 1:100,000-scale and exists at that scale for the whole country. This high-resolution NHD, generally developed at 1:24,000/1:12,000 scale, adds detail to the original 1:100,000-scale NHD. (Data for Alaska, Puerto Rico and the Virgin Islands was developed at high-resolution, not 1:100,000 scale.) Local resolution NHD is being developed where partners and data exist. The NHD contains reach codes for networked features, flow direction, names, and centerline representations for areal water...
Seventy six parent and alkylated polycyclic aromatic compounds, including polycyclic aromatic hydrocarbons (PAHs), were quantified in watershed and reef sediment from Olowalu, Maui, in February 2022 to explore urban and wildfire effects. Sample locations and total organic carbon contents (OC) are available in the accompanying file OlowaluWatershedReef2022_compositions.csv.
Categories: Data;
Tags: CMHRP,
Coastal and Marine Hazards and Resources Program,
Kealaloloa Ridge,
Kihei,
Kulanihakoi Gulch,
This shapefile represents the spatial distribution of mean annual water-budget components, in inches, for the Island of Maui, Hawaii for a projected climate condition representative of phase 3 of the Coupled Model Intercomparison Project (CMIP3) A1B 2080-99 scenario climate and 2017 land cover, as described in USGS SIR 2019-5064. The water-budget components for each model subarea were computed for the future climate condition using a water-budget model developed by Johnson and others (2018). The 2017 land-cover map developed by Mair (2018) was used to define the land-cover conditions and the model subareas. The shapefile attribute information associated with each subarea (or polygon) present an estimate of mean...
These shapefiles represent the spatial distribution of mean annual water-budget components, in inches, for the Island of Maui, Hawaii for a set of eight future climate and land-cover scenarios. The future climate conditions used in the water-budget analyses were derived from two end-of-century downscaled climate projections including (1) a projected future climate condition representative of phase 3 of the Coupled Model Intercomparison Project (CMIP3) A1B 2080-99 scenario climate described in Zhang and others (2016a, 2016b) and (2) a projected future climate condition representative of phase 5 of the Coupled Model Intercomparison Project (CMIP5) Representative Concentration Pathway 8.5 (RCP8.5) 2080-99 scenario...
USGS Historical Quadrangle in GeoPDF.
This data release contains a comma-delimited ascii file of nine discrete discharge measurements made at sites along selected reaches of Palauhulu Stream, Maui, Hawai'i on October 19, 2021 and November 22, 2021. These discrete discharge measurements form what is commonly referred to as a “seepage run.” The intent of the seepage run is to quantify the spatial distribution of streamflow along the reach during fair-weather, low-flow conditions, generally characterized by negligible direct runoff within the reach. The measurements can be used to characterize the net seepage of water into (water gain) or out of (water loss) the stream channel between measurement sites provided that the measurements were made during stable,...
Layered GeoPDF 7.5 Minute Quadrangle Map. Layers of geospatial data include orthoimagery, roads, grids, geographic names, elevation contours, hydrography, and other selected map features.
Layered GeoPDF 7.5 Minute Quadrangle Map. Layers of geospatial data include orthoimagery, roads, grids, geographic names, elevation contours, hydrography, and other selected map features.
Layered GeoPDF 7.5 Minute Quadrangle Map. Layers of geospatial data include orthoimagery, roads, grids, geographic names, elevation contours, hydrography, and other selected map features.
Layered GeoPDF 7.5 Minute Quadrangle Map. Layers of geospatial data include orthoimagery, roads, grids, geographic names, elevation contours, hydrography, and other selected map features.
|

|
