Filters: Types: Citation (X) > Types: OGC WFS Layer (X) > partyWithName: U.S. Geological Survey (X)
536 results (28ms)|
Filters
Contacts
(Less)
|
Region(s) of distribution of Halfbarred Pout (Gymnelus hemifasciatus) Andriashev, 1937 in the Arctic as digitized for U.S. Geological Survey Scientific Investigations Report 2016-5038. For details on the project and purpose, see the report at https://doi.org/10.3133/sir20165038. Complete metadata for the collection of species datasets is in the metadata document "Dataset_for_Alaska_Marine_Fish_Ecology_Catalog.xml" at https://doi.org/10.5066/F7M61HD7. Source(s) for this digitized data layer are listed in the metadata Process Steps section. Note that the original source may show an extended area; some datasets were limited to the published map boundary. Distributions of marine fishes are shown in adjacent Arctic seas...
Categories: Data;
Types: Citation,
Downloadable,
Map Service,
OGC WFS Layer,
OGC WMS Layer,
Shapefile;
Tags: Alaska,
Andriashev, 1937,
Arctic,
Arctic,
Beaufort Sea,
This data release includes time-series data from a monitoring site located in a small drainage basin in the Arroyo Seco watershed in Los Angeles County, CA, USA (N3788964 E389956, UTM Zone 11, NAD83). The site was established after the 2009 Station Fire and recorded a series debris flows in the first winter after the fire. The data include three types of time-series: (1) 1-minute time series of rainfall, soil water content, channel bed pore pressure and temperature, and flow stage recorded by radar and laser distance meters (ArroyoSecoContinuous.csv); (2) 10-Hz time series of flow stage recorded by the laser distance meter during rain storms (ArroyoSecoStormLaser.csv), and (3) 2-second time series of rainfall and...
Categories: Data;
Types: Citation,
Map Service,
OGC WFS Layer,
OGC WMS Layer,
OGC WMS Service;
Tags: Arroyo Seco, California,
GHSC,
Geologic Hazards Science Center,
Landslides Hazards Program,
Los Angeles County, California,
These data are supplementary to the journal article Bassiouni, M., Scholl, M.A., Torres-Sanchez, A.J., Murphy, S.F., 2017, A Method for Quantifying Cloud Immersion in a Tropical Mountain Forest Using Time-Lapse Photography, Agricultural and Forest Meteorology, http://dx.doi.org/10.1016/j.agrformet.2017.04.010. The data set includes cloud immersion frequency, mean temperature, relative humidity and dew point depression values for five sites, representing Figures 7a and 7b in the article, and values used to calculate the averages shown in Table 2. The results cover the time period from March 2014 to May 2016. A list of validation image filenames with their classifications and the set of 7360 validation images for...
Categories: Data;
Types: Citation,
Map Service,
OGC WFS Layer,
OGC WMS Layer,
OGC WMS Service;
Tags: Climatology,
Ecology,
El Yunque National Forest, Puerto Rico,
USGS Science Data Catalog (SDC),
Water Resources,
Data on gold deposits are extracted from an existing publication to enable analysis. The data comprise selected portions of a data set that are published by C.J. Hodgson in "Preliminary Report on the Timmins-Kirkland Lake Area Gold Deposits File," which is available online as a digital image of a report. As an image, the data set cannot be analyzed. Consequently, selected portions of the data set are re-published here in a text file. The datum for the latitude and longitude is not specified in the report and is assumed to be the North American Datum of 1927 (NAD27). The Ontario Geological Survey, Ministry of Northern Development and Mines, Ontario, Canada kindly granted permission to re-publish these data. Hodgson,...
Categories: Data;
Types: Citation,
Map Service,
OGC WFS Layer,
OGC WMS Layer,
OGC WMS Service;
Tags: Abitibi Greenstone Belt,
Canada,
Englehart,
Kirkland Lake,
Lake Abitibi,
Yellowstone River at Corwin Springs, MT (YYCR) Sample Collection: Samples were collected near the USGS stream gage 06191500 (Latitude 45°06'43.63", Longitude 110°47'37.20" NAD83). At the time of collection, all waters samples were filtered through a syringe filter (0.45-micrometer). Two splits of the filtered water were retained for chemical analyses, including an unacidified (FU) sample for determination of anion concentrations and a nitric acid preserved (FA; 1% volume-to-volume concentrated trace-metal grade nitric acid) sample for cation and trace metal analyses. During sample collection, the water temperature, specific conductance, and pH were often measured. Sample Analyses: Concentrations of chloride,...
Categories: Data;
Types: Citation,
Map Service,
OGC WFS Layer,
OGC WMS Layer,
OGC WMS Service;
Tags: Boiling River,
Geothermal,
Yellowstone National Park,
chloride flux
This dataset describes the storm event mean concentrations and loads of total and dissolved forms of phosphorus and nitrogen from paired samples collected in the control and test catchment during the calibration and treatment phase of a leaf removal study in Madison, Wisconsin, USA. Samples were collected in spring 2013 through fall 2015 and are parsed by season where spring represents April – May, summer represents June – September and fall represents October – November. Measured weather parameters for each sampled storm event are also described. These data are interpreted in a journal article published in Science of the Total Environment.
Categories: Data;
Types: Citation,
Map Service,
OGC WFS Layer,
OGC WMS Layer,
OGC WMS Service;
Tags: Madison,
USGS Science Data Catalog (SDC),
Water Quality,
Wisconsin,
nonpoint-source pollution,
The U.S. Geological Survey (USGS) and the National Park Service (NPS) have collaborated on monitoring the chloride flux in the major rivers of Yellowstone National Park by periodically sampling the rivers and analyzing chloride concentrations in discrete water samples since the 1970's. However, restrictions of winter travel, great distances between sites, and sampling and analytical costs have limited collection to approximately 28 samples per site annually. Electrical conductivity data can be used as a proxy for chloride concentrations in many of the major rivers of Yellowstone National Park. Electrical conductivity is a measure of the ability of water to pass an electrical current, and it is affected by the presence...
Categories: Data;
Types: Citation,
Map Service,
OGC WFS Layer,
OGC WMS Layer,
OGC WMS Service;
Tags: USGS Science Data Catalog (SDC),
Water Resources,
Yellowstone National Park,
electrical conductivity,
specific conductance
The US Geological Survey, in cooperation with the National Park Service, mapped 35 7.5-minute quadrangles, within a 2-mile-wide+ corridor centered on the Parkway, from BLRI (Blue Ridge Parkway) Mile Post (MP) 0 near Afton, Virginia southward to MP 218 at Cumberland Knob, approximately 1.3 km south of the Virginia – North Carolina State Line. Detailed bedrock geologic mapping for this project was conducted at 1:24,000-scale by systematically traversing roads, trails, creeks, and ridges within and adjacent to the 2-mile-wide+ corridor along the 216.9-mile length of the BLRI in Virginia. Geologic data at more than 23,000 station points were collected during this project (September 2009 – February 2014), with approximately...
This dataset is the output of a python script/ArcGIS model that identifes dikes as having a difference in elevation above a certain threshold. If the elevation difference was below a certain threshold the area was not considered a dike; however, if the difference in elevation between two points was significantly high then the area was marked as a dike. Areas continuous with eachother were considered part of the same dike. Post processing occured. Users examined the data output, comparing the proposed dike locations to aerial imagery, flowline data, and the DEM. Dikes that appeared to be false positives were deleted from the data set. These data include parameter inputs from external sources current to 2016. For...
Categories: Data;
Types: Citation,
Downloadable,
Map Service,
OGC WFS Layer,
OGC WMS Layer,
Shapefile;
Tags: Great Lakes,
LIDAR,
Lake Erie,
biogeography,
coastal ecosystems,
Surveys of the bathymetry and backscatter intensity of the sea floor south of Long Island, New York, were carried out in November 1998 using a Simrad EM1000 multibeam echosounder mounted on the Canadian Coast Guard ship Frederick G. Creed. The purpose of the multibeam echosounder surveys was to explore the bathymetry and backscatter intensity of the sea floor in several areas off the southern coast of Long Island along the 20-meter isobath. Survey areas offshore of Fire Island Inlet, Moriches Inlet, Shinnecock Inlet, and southwest of Montauk Point were about 1 kilometer (km) wide and 10 km long. The area was mapped by the U.S. Geological Survey with support from the Canadian Hydrographic Service and the University...
Surveys of the bathymetry and backscatter intensity of the sea floor south of Long Island, New York, were carried out in November 1998 using a Simrad EM1000 multibeam echosounder mounted on the Canadian Coast Guard ship Frederick G. Creed. The purpose of the multibeam echosounder surveys was to explore the bathymetry and backscatter intensity of the sea floor in several areas off the southern coast of Long Island along the 20-meter isobath. Survey areas offshore of Fire Island Inlet, Moriches Inlet, Shinnecock Inlet, and southwest of Montauk Point were about 1 kilometer (km) wide and 10 km long. The area was mapped by the U.S. Geological Survey with support from the Canadian Hydrographic Service and the University...
About 280 kilometers of multichannel (common-depth-point) seismic reflection profiles were obtained in the central Mississippi River Valley by Geophysical Service Inc. and Western Geophysical Company under contracts with the U.S. Geological Survey. The specific area of the profiles is southeastern Missouri, northeastern Arkansas, and northwestern Tennessee. Geologically, the area is located in the northern part of the Mississippi Embayment.
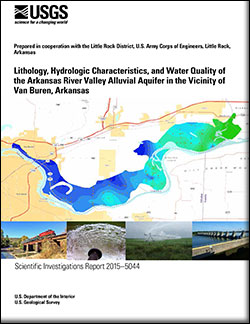
Categories: Publication;
Types: Citation,
Map Service,
OGC WFS Layer,
OGC WMS Layer,
OGC WMS Service;
Tags: Scientific Investigations Report
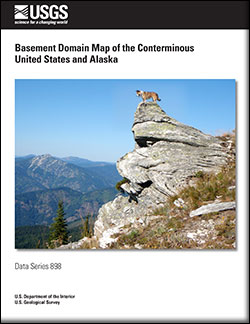
Categories: Publication;
Types: Citation,
Map Service,
OGC WFS Layer,
OGC WMS Layer,
OGC WMS Service;
Tags: Data Series
Shapefile containing the boundary of the Alaska Climate Adaptation Science Center (CASC).
Categories: Data;
Types: Citation,
Downloadable,
Map Service,
OGC WFS Layer,
OGC WMS Layer,
Shapefile;
Tags: Alaska,
Climate Science Center,
boundaries
Shapefile containing the boundary of the Northwest Climate Adaptation Science Center (CASC).
Categories: Data;
Types: Citation,
Downloadable,
Map Service,
OGC WFS Layer,
OGC WMS Layer,
Shapefile;
Tags: Climate Science Center,
Washington, Oregon, Idaho,
boundaries
Fault Source parameters used as input to 2002 National Seismic Hazard Map.
Categories: Data;
Types: Citation,
Downloadable,
Map Service,
OGC WFS Layer,
OGC WMS Layer,
Shapefile;
Tags: seismic hazard,
tbd
Spatial polygons of vegetation zones in 1988 for wetlands; P1, P2, P3, P4, P7, P8, T2, T3, T4, T5, T6, T7, T8, and T9 within the Cottonwood Lake Study Area, Stutsman County, North Dakota. Created from a collection of digital orthorectified images from aerial photographs of the study area acquired during 1988 using Stewart and Kantrud classification system.
Categories: Data;
Types: Citation,
Downloadable,
Map Service,
OGC WFS Layer,
OGC WMS Layer,
Shapefile;
Tags: Cottonwood Lake Study Area,
EARTH SCIENCE>BIOSPHERE>AQUATIC ECOSYSTEMS>WETLANDS>LACUSTRINE WETLANDS,
EARTH SCIENCE>BIOSPHERE>AQUATIC ECOSYSTEMS>WETLANDS>PALUSTRINE WETLANDS,
EARTH SCIENCE>BIOSPHERE>TERRESTRIAL ECOSYSTEMS>WETLANDS>LACUSTRINE WETLANDS,
EARTH SCIENCE>BIOSPHERE>TERRESTRIAL ECOSYSTEMS>WETLANDS>PALUSTRINE WETLANDS,
Spatial polygons of vegetation zones in 2000 for wetlands; P1, P2, P3, P4, P6, P7, P8, P11, T1, T2, T3, T4, T5, T6, T7, T8, and T9 within the Cottonwood Lake Study Area, Stutsman County, North Dakota. Created from a collection of digital orthorectified images from aerial photographs of the study area acquired during 2000 using Stewart and Kantrud classification system.
Categories: Data;
Types: Citation,
Downloadable,
Map Service,
OGC WFS Layer,
OGC WMS Layer,
Shapefile;
Tags: Cottonwood Lake Study Area,
EARTH SCIENCE>BIOSPHERE>AQUATIC ECOSYSTEMS>WETLANDS>LACUSTRINE WETLANDS,
EARTH SCIENCE>BIOSPHERE>AQUATIC ECOSYSTEMS>WETLANDS>PALUSTRINE WETLANDS,
EARTH SCIENCE>BIOSPHERE>TERRESTRIAL ECOSYSTEMS>WETLANDS>LACUSTRINE WETLANDS,
EARTH SCIENCE>BIOSPHERE>TERRESTRIAL ECOSYSTEMS>WETLANDS>PALUSTRINE WETLANDS,
Spatial polygons of vegetation zones in 2009 for wetlands; P1, P2, P3, P4, P6, P7, P8, P11, T1, T2, T3, T4, T5, T6, T7, T8, and T9 within the Cottonwood Lake Study Area, Stutsman County, North Dakota. Created from a collection of digital orthorectified images from aerial photographs of the study area acquired during 2009 using Stewart and Kantrud classification system.
Categories: Data;
Types: Citation,
Downloadable,
Map Service,
OGC WFS Layer,
OGC WMS Layer,
Shapefile;
Tags: Cottonwood Lake Study Area,
EARTH SCIENCE>BIOSPHERE>AQUATIC ECOSYSTEMS>WETLANDS>LACUSTRINE WETLANDS,
EARTH SCIENCE>BIOSPHERE>AQUATIC ECOSYSTEMS>WETLANDS>PALUSTRINE WETLANDS,
EARTH SCIENCE>BIOSPHERE>TERRESTRIAL ECOSYSTEMS>WETLANDS>LACUSTRINE WETLANDS,
EARTH SCIENCE>BIOSPHERE>TERRESTRIAL ECOSYSTEMS>WETLANDS>PALUSTRINE WETLANDS,
|

|
