Filters: Tags: ocean (X)
345 results (46ms)|
Filters
Date Range
Extensions Types
Contacts
Categories Tag Types
|
The purpose of the Coral Reef Evaluation and Monitoring Project (CREMP) is to monitor the status and trends of selected reefs in the Florida Keys National Marine Sanctuary(FKNMS). CREMP assessments have been conducted annually at fixed sites since 1996 and data collected provides information on the temporal changes in benthic cover and diversity of stony corals and associated marine flora and fauna. The core field methods continue to be underwater videography and timed coral species inventories. Findings presented in this report include data from 109 stations at 37 sites sampled from 1996 through 2008 in the Florida Keys and 1999 through 2008 in the Dry Tortugas. The report describes the annual differences (between...
Categories: Data;
Types: NetCDF OPeNDAP Service;
Tags: Coral Reef Evaluation and Monitoring Project (CREMP),
about,
absence,
accepted,
acceptedNameAuthorship,
The purpose of the Coral Reef Evaluation and Monitoring Project (CREMP) is to monitor the status and trends of selected reefs in the Florida Keys National Marine Sanctuary(FKNMS). CREMP assessments have been conducted annually at fixed sites since 1996 and data collected provides information on the temporal changes in benthic cover and diversity of stony corals and associated marine flora and fauna. The core field methods continue to be underwater videography and timed coral species inventories. Findings presented in this report include data from 109 stations at 37 sites sampled from 1996 through 2008 in the Florida Keys and 1999 through 2008 in the Dry Tortugas. The report describes the annual differences (between...
Categories: Data;
Types: NetCDF OPeNDAP Service;
Tags: Coral Reef Evaluation and Monitoring Project Florida Keys 2018,
area,
array,
array-data,
biogeographic,
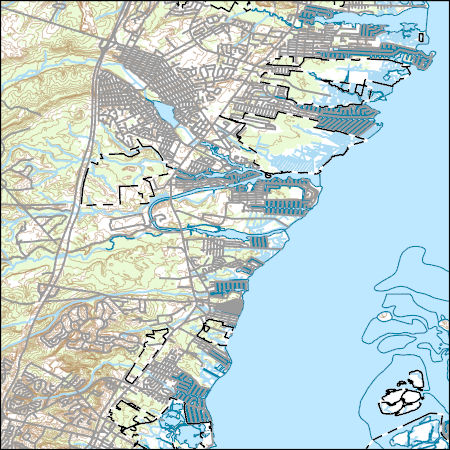
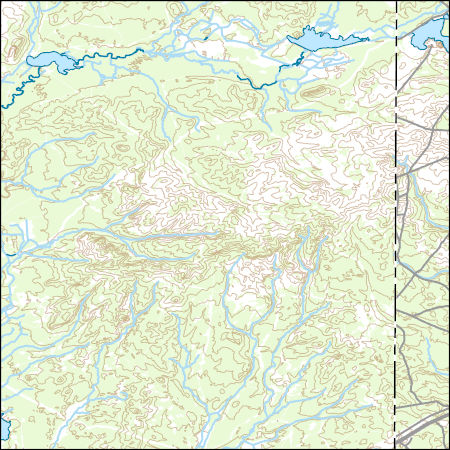
Layers of geospatial data include contours, boundaries, land cover, hydrography, roads, transportation, geographic names, structures, and other selected map features.
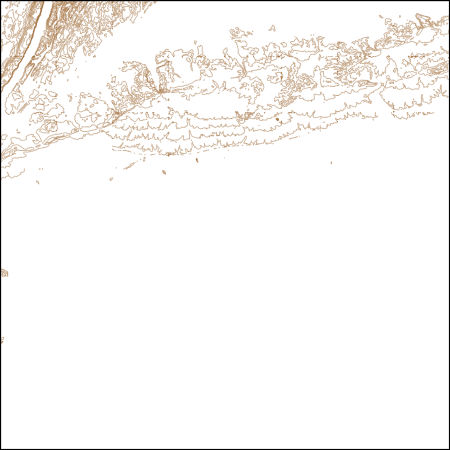
These vector contour lines are derived from the 3D Elevation Program using automated and semi-automated processes. They were created to support 1:24,000-scale CONUS and Hawaii, 1:25,000-scale Alaska, and 1:20,000-scale Puerto Rico / US Virgin Island topographic map products, but are also published in this GIS vector format. Contour intervals are assigned by 7.5-minute quadrangle, so this vector dataset is not visually seamless across quadrangle boundaries. The vector lines have elevation attributes (in feet above mean sea level on NAVD88), but this dataset does not carry line symbols or annotation.
Geospatial data includes structures and other selected map features.
Layers of geospatial data include contours, boundaries, land cover, hydrography, roads, transportation, geographic names, structures, and other selected map features.
Layers of geospatial data include contours, boundaries, land cover, hydrography, roads, transportation, geographic names, structures, and other selected map features.
Layers of geospatial data include contours, boundaries, land cover, hydrography, roads, transportation, geographic names, structures, and other selected map features.
Types: Citation;
Tags: 7.5 x 7.5 minute,
7_5_Min,
Combined Vector,
Combined Vector,
Combined Vector,
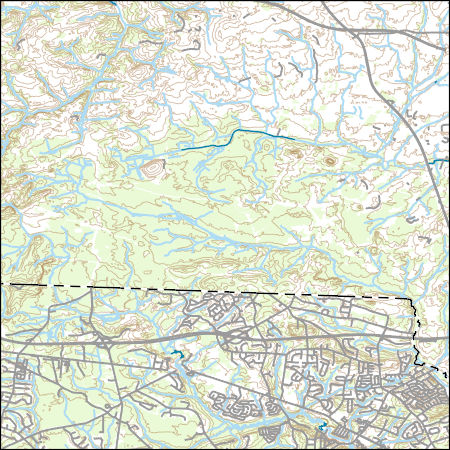
Layers of geospatial data include contours, boundaries, land cover, hydrography, roads, transportation, geographic names, structures, and other selected map features.
Types: Citation;
Tags: 7.5 x 7.5 minute,
7_5_Min,
Combined Vector,
Combined Vector,
Combined Vector,
Layers of geospatial data include contours, boundaries, land cover, hydrography, roads, transportation, geographic names, structures, and other selected map features.
Layers of geospatial data include contours, boundaries, land cover, hydrography, roads, transportation, geographic names, structures, and other selected map features.

Layers of geospatial data include contours, boundaries, land cover, hydrography, roads, transportation, geographic names, structures, and other selected map features.
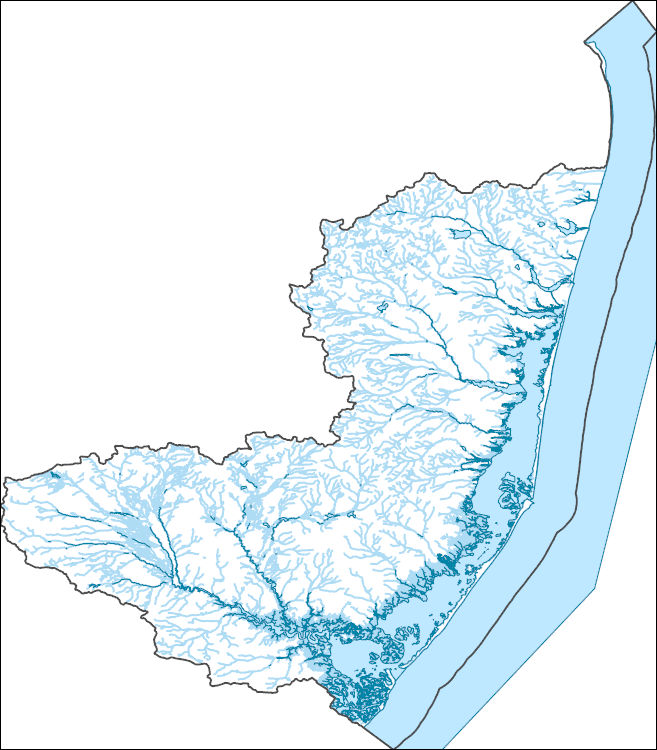
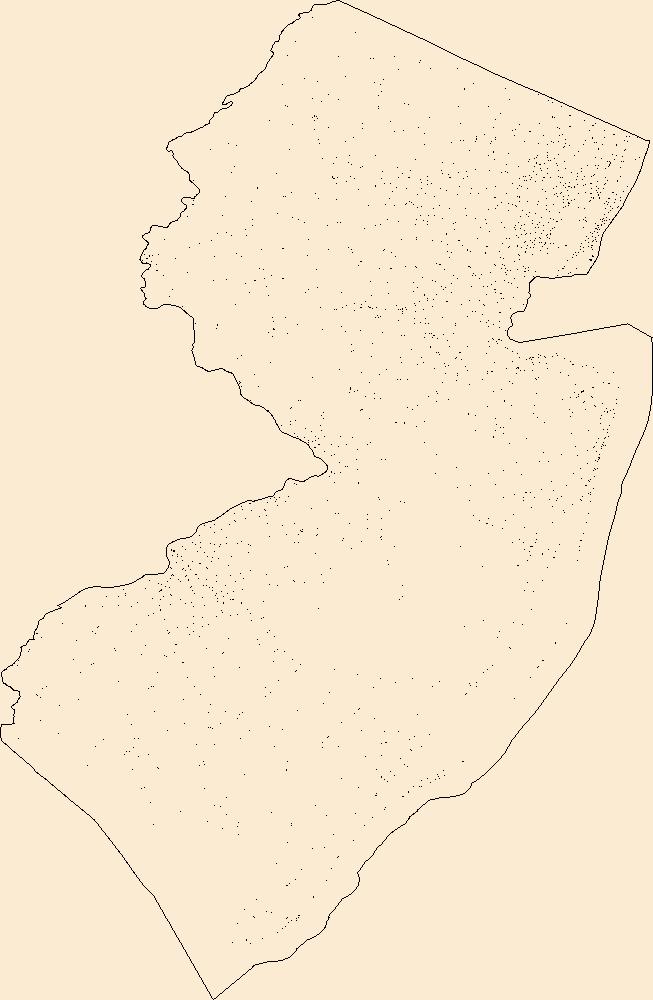
The National Hydrography Dataset (NHD) is a feature-based database that interconnects and uniquely identifies the stream segments or reaches that make up the nation's surface water drainage system. NHD data was originally developed at 1:100,000-scale and exists at that scale for the whole country. This high-resolution NHD, generally developed at 1:24,000/1:12,000 scale, adds detail to the original 1:100,000-scale NHD. (Data for Alaska, Puerto Rico and the Virgin Islands was developed at high-resolution, not 1:100,000 scale.) Local resolution NHD is being developed where partners and data exist. The NHD contains reach codes for networked features, flow direction, names, and centerline representations for areal water...
Here we present surface current results from a physics-based, 3-dimensional coupled ocean-atmosphere numerical model that was generated to understand coral larval dispersal patterns in Maui Nui, Hawaii, USA. The model was used to simulate coral larval dispersal patterns from a number of existing State-managed reefs and large tracks of reefs with high coral coverage that might be good candidates for marine-protected areas (MPAs) during 8 spawning events during 2010-2013. The goal of this effort is to provide geophysical data to help provide guidance to sustain coral health in Maui Nui, Hawaii, USA. Each model output run is available as a netCDF file with self-contained attribute information. Each file name is appended...
Categories: Data;
Types: Citation,
Map Service,
NetCDF OPeNDAP Service,
OGC WFS Layer,
OGC WMS Layer,
OGC WMS Service;
Tags: CMGP,
Coastal and Marine Geology Program,
Geophysics,
Hawaii,
Kahoolawe,
Passive membrane samplers—semipermeable membrane devices and polar organic chemical integrative samplers—were deployed for 22 continuous days at 7 sites along the West Maui, Hawai'i, coastline in February and March 2017 to assess organic contaminants at shallow coral reef ecosystems from diverse upstream inputs.
Categories: Data;
Tags: CMHRP,
Coastal and Marine Hazards and Resources Program,
Environmental Health,
Geochemistry,
Honokeana,
This data set contains imagery from the National Agriculture Imagery Program (NAIP). The NAIP program is administered by USDA FSA and has been established to support two main FSA strategic goals centered on agricultural production. These are, increase stewardship of America's natural resources while enhancing the environment, and to ensure commodities are procured and distributed effectively and efficiently to increase food security. The NAIP program supports these goals by acquiring and providing ortho imagery that has been collected during the agricultural growing season in the U.S. The NAIP ortho imagery is tailored to meet FSA requirements and is a fundamental tool used to support FSA farm and conservation programs....
This data set contains imagery from the National Agriculture Imagery Program (NAIP). The NAIP program is administered by USDA FSA and has been established to support two main FSA strategic goals centered on agricultural production. These are, increase stewardship of America's natural resources while enhancing the environment, and to ensure commodities are procured and distributed effectively and efficiently to increase food security. The NAIP program supports these goals by acquiring and providing ortho imagery that has been collected during the agricultural growing season in the U.S. The NAIP ortho imagery is tailored to meet FSA requirements and is a fundamental tool used to support FSA farm and conservation programs....
Layered GeoPDF 7.5 Minute Quadrangle Map. Layers of geospatial data include orthoimagery, roads, grids, geographic names, elevation contours, hydrography, and other selected map features.
The Sea Surface Temperature (SST) data of the nearshore region of the North Pacific show temperature ranges in degrees C using points whose locations correspond to the centroids of AVHRR Pathfinder version 5 monthly, global, 4 km data set (PFSST V50). The pathfinder rasters are available from the Physical Oceanography Distributed Active Archive Center (PO.DAAC), hosted by NASA JPL. The data points in this dataset lie within a 20 km buffer from the GSHHS (Global Self-consistent, Hierarchical, High-resolution Shoreline) coastline. The GSHHS vector data are available from the National Geophysical Data Center (NGDC). Furthermore, each point in the SST dataset is categorized by the ecoregion in which it is located. This...
Layered GeoPDF 7.5 Minute Quadrangle Map. Layers of geospatial data include orthoimagery, roads, grids, geographic names, elevation contours, hydrography, and other selected map features.
|

|
