Filters: Tags: landuse (X)
86 results (38ms)|
Filters
Date Range
Extensions Types Contacts
Categories Tag Types
|
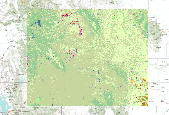
Potential pollinator habitat was derived by ranking land use classifications and grassland quality based on ground truthing and remotely sensed features indicative of remnant prairie. High resolution (10m) land use data served as the basemap (Hartley et al 2017) from which most categories were identified. All known prairie remnants, prairie plantings, and clusters of mima mounds were delineated. Mima mounds were detected by deriving a slope at 1m scale with greater than 5% from high resolution LiDar data (3m). Mima mounds are indicative of areas in which the topsoil has not been significantly disturbed, and therefore have a higher potential to contain native prairie vegetation. Based on an in-depth literature review...
Categories: Data;
Types: Citation,
Downloadable,
GeoTIFF,
Map Service,
Raster;
Tags: Landcover,
Landuse,
USGS Science Data Catalog (SDC),
coastal Louisiana,
environment,

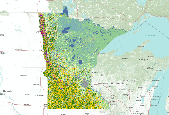
The USDA, NASS Cropland Data Layer (CDL) is a raster, geo-referenced, crop-specific land cover data layer. The 2010 CDL has a ground resolution of 30 meters. The CDL is produced using satellite imagery from the Landsat 5 TM sensor, Landsat 7 ETM+ sensor, and the Indian Remote Sensing RESOURCESAT-1 (IRS-P6) Advanced Wide Field Sensor (AWiFS) collected during the current growing season.Some CDL states used additional satellite imagery and ancillary inputs to supplement and improve the classification. These additional sources can include the United States Geological Survey (USGS) National Elevation Dataset (NED), the USGS National Land Cover Dataset 2001 (NLCD 2001), and the National Aeronautics and Space Administration...

The Title 4 Land data delineates the following 3 areas where landuse is restricted: 1. In Regionally Significant Industrial Areas (Plan = RSI), non-industrial uses are limited to: Retail uses less than 20,000 square feet and amounting to only 5 percent of the contiguous Regionally Significant Industrial Area. Commercial office uses that are not accessory to the industrial uses with the exception of large corporate headquarters. And uses necessary to serve the needs of businesses and employees of the Regionally Significant Industrial Area. 2. In Industrial Areas (Plan = IND), non-industrial uses are limited to less than 20,000 square feet and amount to 10 percent of the Industrial Area. 3. In Employment Areas (Plan...
The dataset includes Land Use/Land Cover types throughout the Chenier Eco-Region in Southwest Louisiana. Using the 2015 NAIP dataset (1m) as the basemap, E-Cognition image objects were derived from the multiresolution segmentation algorithm at 75 and 250 segments. Attempts to refine the data training methods using E-cognition, to extrapolate automating categories of this information to the entire map resulted with exceedingly low accuracy. Therefore, a raster was produced by piecing together several data resources, which provide reliable data for specific LULC categories. This process involved stitching together more reliable sources for specific categories to apply to higher resolution (75) segmentation product....
Categories: Data;
Types: Citation,
Map Service,
OGC WFS Layer,
OGC WMS Layer,
OGC WMS Service;
Tags: 2015,
Complete,
Data,
EARTH SCIENCE,
EARTH SCIENCE > LAND SURFACE,

The USDA, NASS Cropland Data Layer (CDL) is a raster, geo-referenced, crop-specific land cover data layer. The 2010 CDL has a ground resolution of 30 meters. The CDL is produced using satellite imagery from the Landsat 5 TM sensor, Landsat 7 ETM+ sensor, and the Indian Remote Sensing RESOURCESAT-1 (IRS-P6) Advanced Wide Field Sensor (AWiFS) collected during the current growing season.Some CDL states used additional satellite imagery and ancillary inputs to supplement and improve the classification. These additional sources can include the United States Geological Survey (USGS) National Elevation Dataset (NED), the USGS National Land Cover Dataset 2001 (NLCD 2001), and the National Aeronautics and Space Administration...
This dataset is the second (circa 2000) in a series of three 1-kilometer land use land cover (LULC) time-periods datasets (1975, 2000, and 2013) aids in monitoring change in West Africa’s land resources. To monitor and map these changes, a 26 general LULC class system was used. The classification system that was developed was primarily inspired by the “Yangambi Classification” (Trochain, 1957). This fairly broad class system for LULC was used because the classes can be readily identified on Landsat satellite imagery. A visual photo-interpretation approach was used to identify and map the LULC classes represented on Landsat images. The Rapid Land Cover Mapper (RLCM) was used to facilitate the photo-interpretation...
Categories: Data;
Types: Downloadable,
GeoTIFF,
Map Service,
Raster;
Tags: Gambia,
Land Cover,
Land Use,
biota,
land cover,
A detailed table summarizing the irrigated acreage by crop type and irrigation system was developed for the 2018 growing season (November 2017 and September 2018) for Lee County, Florida. The acreage totals presented are derived from the results of a cooperative project that mapped and field-verified irrigated fields in Lee County, Florida. In addition, the table provides acreage totals by crop type published by the U.S. Department of Commerce for 1978 and 1982 and the U.S. Department of Agriculture for years between 1987 and 2012.
Categories: Data;
Types: Map Service,
OGC WFS Layer,
OGC WMS Layer,
OGC WMS Service;
Tags: Crop type,
Environment,
Florida,
Florida Department of Agriculture and Consumer Service,
Groundwater,
Table 3. Reported and inventoried crop and irrigated acreage in Okaloosa County, Florida, 1974–2016.
A detailed inventory of irrigated crop acreage is not available at the level of resolution needed to accurately estimate agricultural water-use or to project future water demands in many Florida counties. A detailed summary table of irrigated acreage for the 2016 growing season was developed for Okaloosa County by the U.S. Geological Survey (USGS) and includes totals of acreage by irrigation system. It also provides a comparison between published acreage totals for previous years by the U.S. Department of Agriculture (USDA) Census of Agriculture and those determined from the 2016 inventory. The irrigated acreage estimated by the USGS for the2016 inventory was 351 acres.
Categories: Data;
Types: Citation;
Tags: Crop type,
Environment,
Florida,
Florida Department of Agriculture and Consumer Service,
Groundwater,

These data were released prior to the October 1, 2016 effective date for the USGS’s policy dictating the review, approval, and release of scientific data as referenced in USGS Survey Manual Chapter 502.8 Fundamental Science Practices: Review and Approval of Scientific Data for Release. Estimates of area and aerial extent of land-use categories are an essential component for computing the water budget of the High Plains aquifer. These raster land-use land class data represent yearly simulated future land use for the High Plains from 2009 to 2050 These data were developed using the FOREcasting SCEnarios (FORE-SCE) of future land cover model (Sohl and others, 2007; Sohl and Sayler 2008) for two (A2 and B2) of the...
This dataset is the second (circa 2000) in a series of three 2-kilometer land use land cover (LULC) time-periods datasets (1975, 2000, and 2013) aids in monitoring change in West Africa’s land resources (exception is Tchad at 4 kilometers). To monitor and map these changes, a 26 general LULC class system was used. The classification system that was developed was primarily inspired by the “Yangambi Classification” (Trochain, 1957). This fairly broad class system for LULC was used because the classes can be readily identified on Landsat satellite imagery. A visual photo-interpretation approach was used to identify and map the LULC classes represented on Landsat images. The Rapid Land Cover Mapper (RLCM) was used to...
Categories: Data;
Types: Downloadable,
GeoTIFF,
Map Service,
Raster;
Tags: Benin,
Burkina Faso,
Cape Verde,
Capo Verde,
Chad,
The USDA, NASS Cropland Data Layer (CDL) is a raster, geo-referenced, crop-specific land cover data layer. The 2010 CDL has a ground resolution of 30 meters. The CDL is produced using satellite imagery from the Landsat 5 TM sensor, Landsat 7 ETM+ sensor, and the Indian Remote Sensing RESOURCESAT-1 (IRS-P6) Advanced Wide Field Sensor (AWiFS) collected during the current growing season.Some CDL states used additional satellite imagery and ancillary inputs to supplement and improve the classification. These additional sources can include the United States Geological Survey (USGS) National Elevation Dataset (NED), the USGS National Land Cover Dataset 2001 (NLCD 2001), and the National Aeronautics and Space Administration...
A detailed table summarizing the irrigated acreage by crop type and irrigation system was developed for the 2018 growing season (November 2017 and September 2018) for Manatee County, Florida. The acreage totals presented are derived from the results of a cooperative project that mapped and field-verified irrigated fields in Manatee County, Florida. In addition, the table provides acreage totals by crop type published by the U.S. Department of Commerce for 1978 and 1982 and the U.S. Department of Agriculture for years between 1987 and 2012.
Categories: Data;
Types: Map Service,
OGC WFS Layer,
OGC WMS Layer,
OGC WMS Service;
Tags: Crop type,
Environment,
Florida,
Florida Department of Agriculture and Consumer Service,
Groundwater,
This data set consists of a detailed digital map of the areal extent of fields and a summary of the irrigated acreage for the 2018 growing season developed for Hardee County, Florida. Selected attribute data that include crop type, irrigation system, and primary water source were collected for each irrigated field.
Categories: Data;
Types: Downloadable,
Map Service,
OGC WFS Layer,
OGC WMS Layer,
Shapefile;
Tags: Crop type,
Florida Department of Agriculture and Consumer Service,
Groundwater,
Irrigation type,
Landuse,

These data were released prior to the October 1, 2016 effective date for the USGS’s policy dictating the review, approval, and release of scientific data as referenced in USGS Survey Manual Chapter 502.8 Fundamental Science Practices: Review and Approval of Scientific Data for Release. This polygon data set provides ancillary information to supplement a release of enhanced U.S. Geological Survey (USGS) historical land-use and land-cover data. The data set presents some of the original file-header documentation, as well as some details describing how the data files were used in the data release, in a geographic context.

These data were released prior to the October 1, 2016 effective date for the USGS’s policy dictating the review, approval, and release of scientific data as referenced in USGS Survey Manual Chapter 502.8 Fundamental Science Practices: Review and Approval of Scientific Data for Release. This polygon data set documents the spatial extent of polygon files included in a release of enhanced U.S. Geological Survey historical land-use and land-cover data.
This dataset is the first (circa 1975) in a series of three 1-kilometer land use land cover (LULC) time-periods datasets (1975, 2000, and 2013) aids in monitoring change in West Africa’s land resources. To monitor and map these changes, a 26 general LULC class system was used. The classification system that was developed was primarily inspired by the “Yangambi Classification” (Trochain, 1957). This fairly broad class system for LULC was used because the classes can be readily identified on Landsat satellite imagery. A visual photo-interpretation approach was used to identify and map the LULC classes represented on Landsat images. The Rapid Land Cover Mapper (RLCM) was used to facilitate the photo-interpretation...
Categories: Data;
Types: Downloadable,
GeoTIFF,
Map Service,
Raster;
Tags: Gambia,
Land Cover,
Land Use,
biota,
land cover,

The USDA, NASS Cropland Data Layer (CDL) is a raster, geo-referenced, crop-specific land cover data layer. The 2010 CDL has a ground resolution of 30 meters. The CDL is produced using satellite imagery from the Landsat 5 TM sensor, Landsat 7 ETM+ sensor, and the Indian Remote Sensing RESOURCESAT-1 (IRS-P6) Advanced Wide Field Sensor (AWiFS) collected during the current growing season.Some CDL states used additional satellite imagery and ancillary inputs to supplement and improve the classification. These additional sources can include the United States Geological Survey (USGS) National Elevation Dataset (NED), the USGS National Land Cover Dataset 2001 (NLCD 2001), and the National Aeronautics and Space Administration...

The USDA, NASS Cropland Data Layer (CDL) is a raster, geo-referenced, crop-specific land cover data layer. The 2010 CDL has a ground resolution of 30 meters. The CDL is produced using satellite imagery from the Landsat 5 TM sensor, Landsat 7 ETM+ sensor, and the Indian Remote Sensing RESOURCESAT-1 (IRS-P6) Advanced Wide Field Sensor (AWiFS) collected during the current growing season.Some CDL states used additional satellite imagery and ancillary inputs to supplement and improve the classification. These additional sources can include the United States Geological Survey (USGS) National Elevation Dataset (NED), the USGS National Land Cover Dataset 2001 (NLCD 2001), and the National Aeronautics and Space Administration...
The USDA, NASS Cropland Data Layer (CDL) is a raster, geo-referenced, crop-specific land cover data layer. The 2010 CDL has a ground resolution of 30 meters. The CDL is produced using satellite imagery from the Landsat 5 TM sensor, Landsat 7 ETM+ sensor, and the Indian Remote Sensing RESOURCESAT-1 (IRS-P6) Advanced Wide Field Sensor (AWiFS) collected during the current growing season.Some CDL states used additional satellite imagery and ancillary inputs to supplement and improve the classification. These additional sources can include the United States Geological Survey (USGS) National Elevation Dataset (NED), the USGS National Land Cover Dataset 2001 (NLCD 2001), and the National Aeronautics and Space Administration...

This dataset is used to denote USFS Land Use Designations (LUD) on the Tongass National Forest. Chapter 3, of Land and Resource Management Plan includes the complete management prescription for the 19 LUDS used in the Forest Plan. Please refer to the following document for further information:Â https://fs.usda.gov/Internet/FSE_DOCUMENTS/stelprdb5367422.pdfNote: Private land was taken out from this layer. Before doing any calculations, users will need to overlay with currrent ownership.
|

|
