Filters: Tags: hydrological (X)
41 results (9ms)|
Filters
Date Range
Extensions Types Contacts
Categories Tag Types Tag Schemes |
Assessment Watersheds are mesoscale aquatic units designed to replace the 3rd order 1:50K watersheds. Assessment Watersheds are based on groupings of fundamental watersheds using FWA watershed code and local code, with a target size of between 2,000ha and 10,000ha. Data prepared as a part of the BC Freshwater Atlas.
Types: Map Service,
OGC WFS Layer,
OGC WMS Layer,
OGC WMS Service;
Tags: BC,
British Columbia,
CWB ,
Canada,
Corporate Watershed Base ,

This dataset, termed "GAGES II", an acronym for Geospatial Attributes of Gages for Evaluating Streamflow, version II, provides geospatial data and classifications for 9,322 stream gages maintained by the U.S. Geological Survey (USGS). It is an update to the original GAGES, which was published as a Data Paper on the journal Ecology's website (Falcone and others, 2010b) in 2010. The GAGES II dataset consists of gages which have had either 20+ complete years (not necessarily continuous) of discharge record since 1950, or are currently active, as of water year 2009, and whose watersheds lie within the United States, including Alaska, Hawaii, and Puerto Rico. Reference gages were identified based on indicators that they...
Types: Map Service,
OGC WFS Layer,
OGC WMS Layer,
OGC WMS Service;
Tags: Alabama,
Alaska,
All 50 states,
Arizona,
Arkansas,
The NetMap concept is based on standardized, contiguous digital map databases that interact with a plug & play analysis tool library (erosion, stream temperature, in-stream wood etc.) to create customizable analysis platforms for decision support in a wide range of natural resource activities. Refer to the 2009 American Geophysical Union article on “the future of applied watershed science at regional scales” for additional information (available for download at the bottom of NetMap’s home page). The uniform, contiguous and attributed stream map databases can be downloaded, and then adjusted with respect to locations of channel heads, drainage density and the length scales of stream networks (default stream segment...
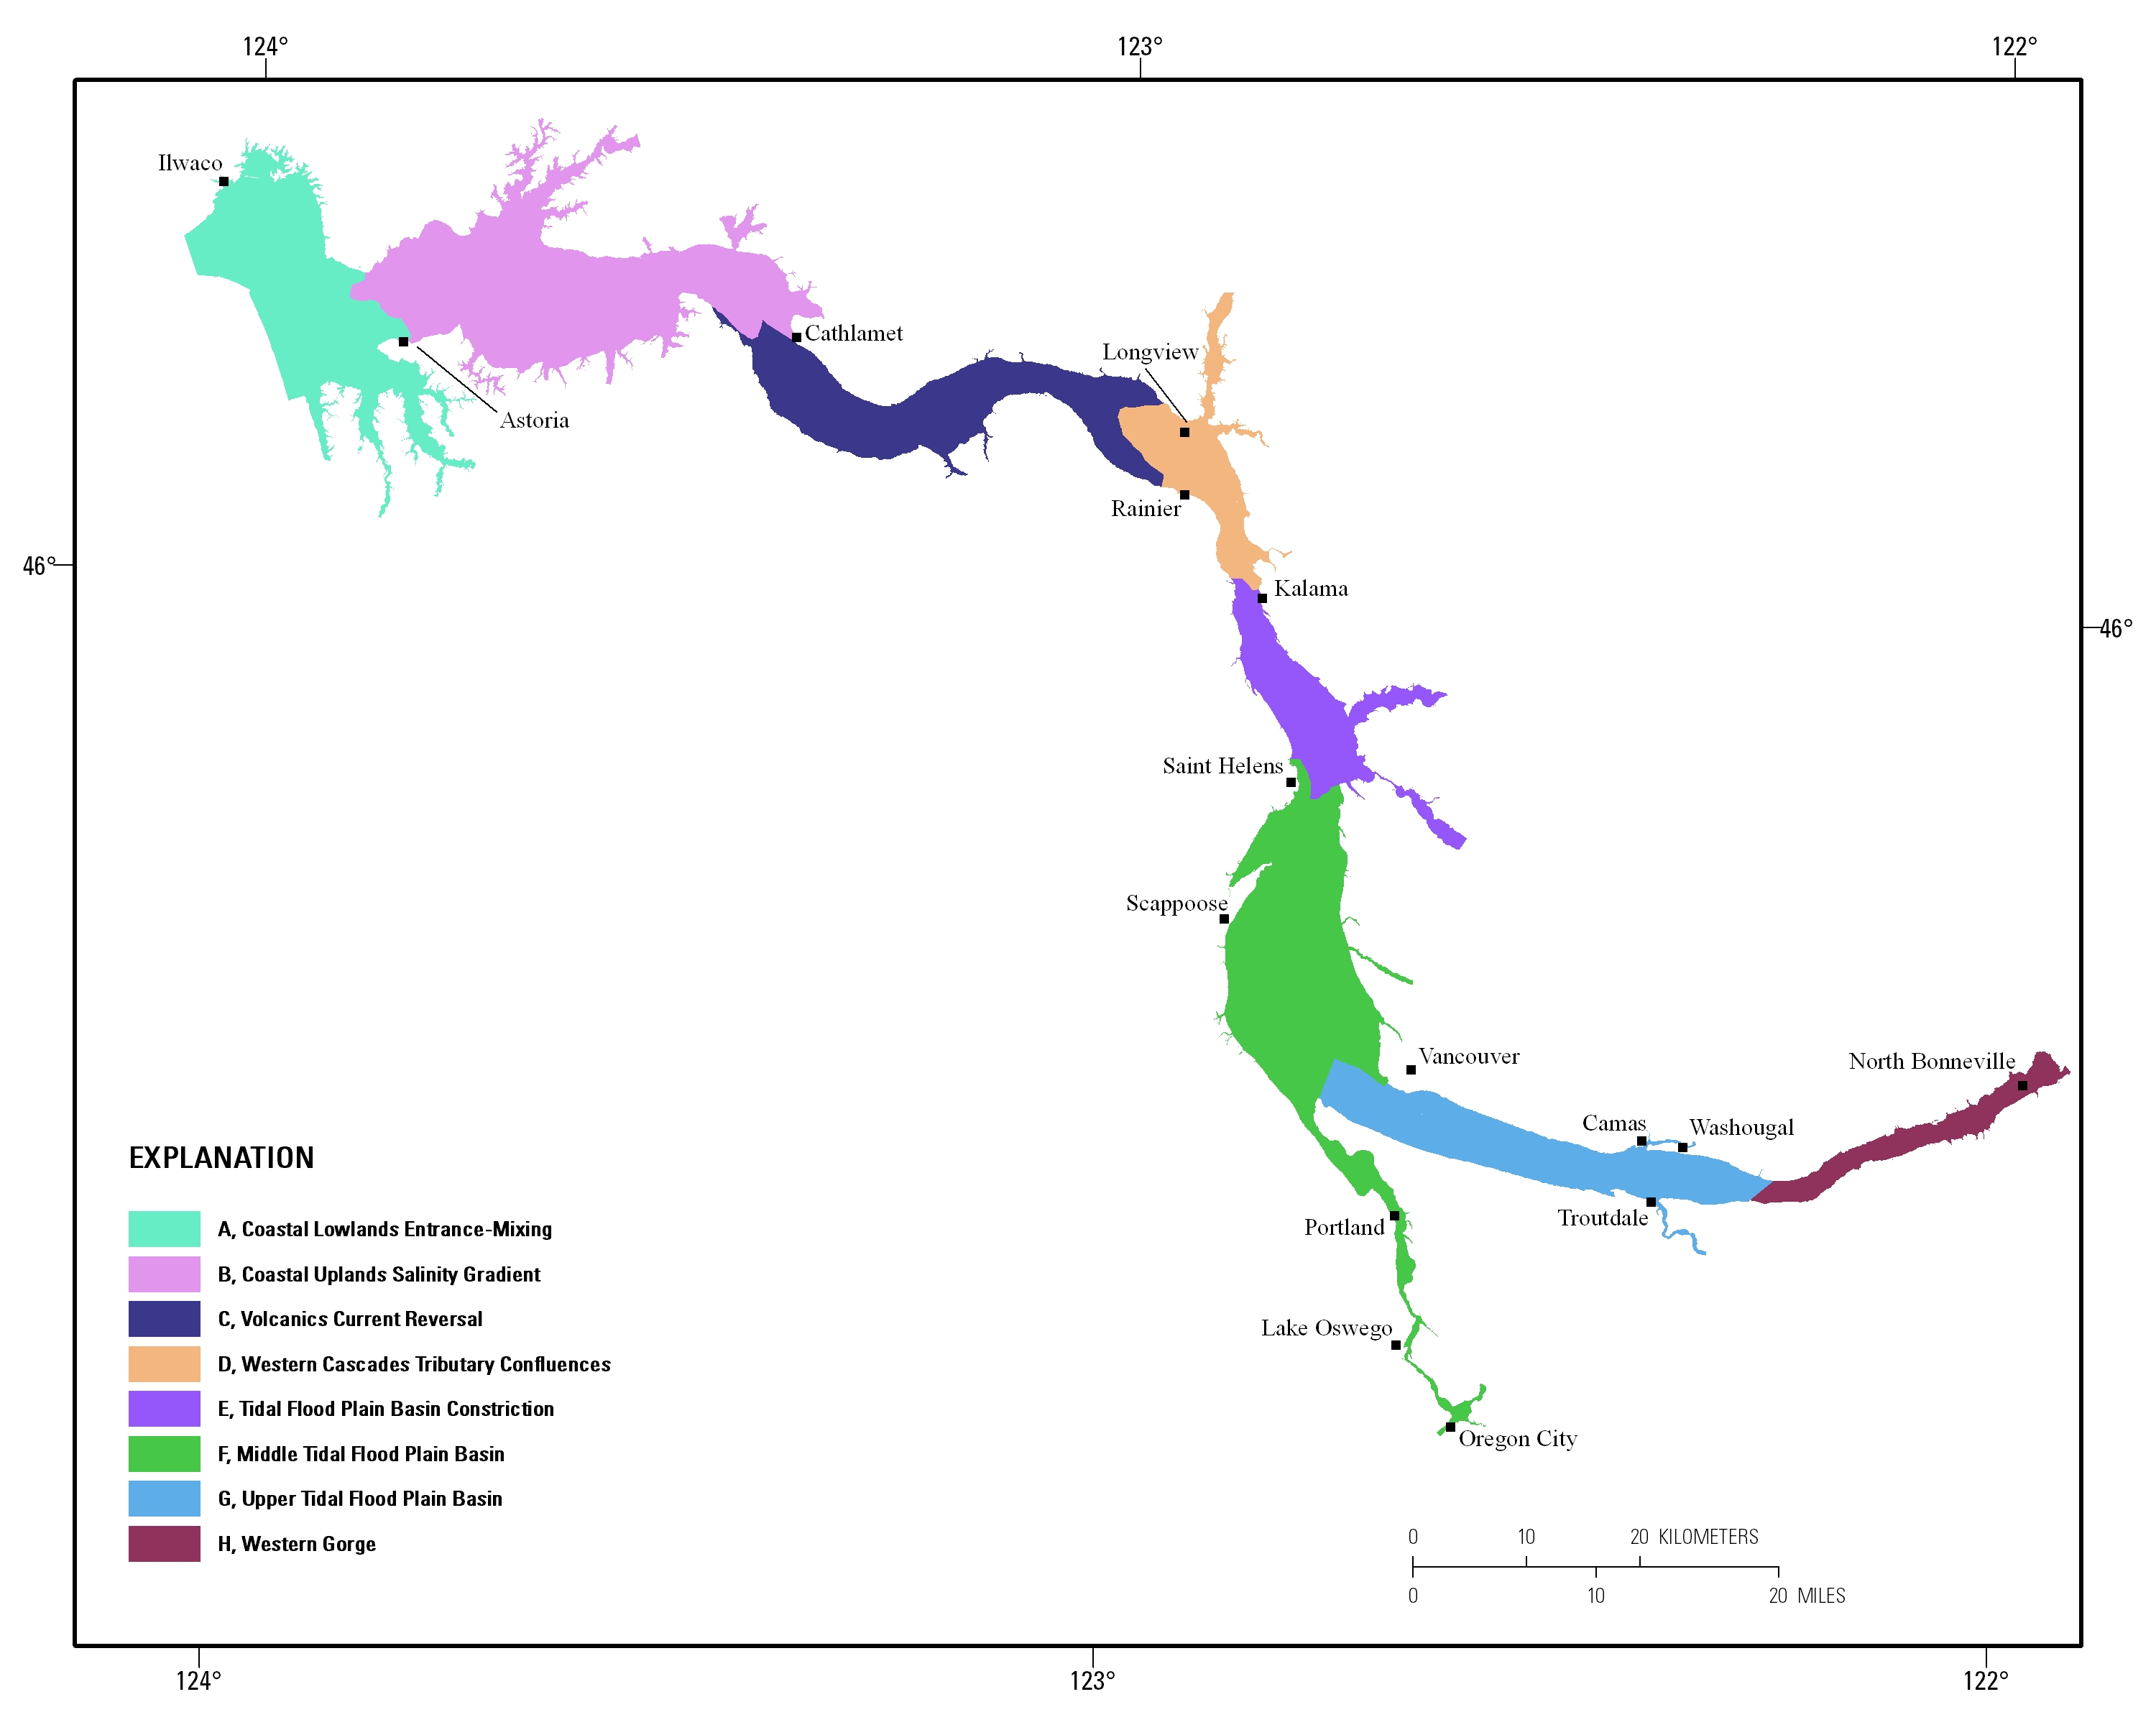
Estuarine ecosystems are controlled by a variety of processes that operate at multiple spatial and temporal scales. Understanding the hierarchical nature of these processes will aid in prioritization of restoration efforts. This hierarchical Columbia River Estuary Ecosystem Classification (henceforth "Classification") of the Columbia River estuary is a spatial database of the tidally-influenced reaches of the lower Columbia River, the tidally affected parts of its tributaries, and the landforms that make up their floodplains for the 230 kilometers between the Pacific Ocean and Bonneville Dam. This work is a collaborative effort between University of Washington School of Aquatic and Fishery Sciences (henceforth "UW"),...
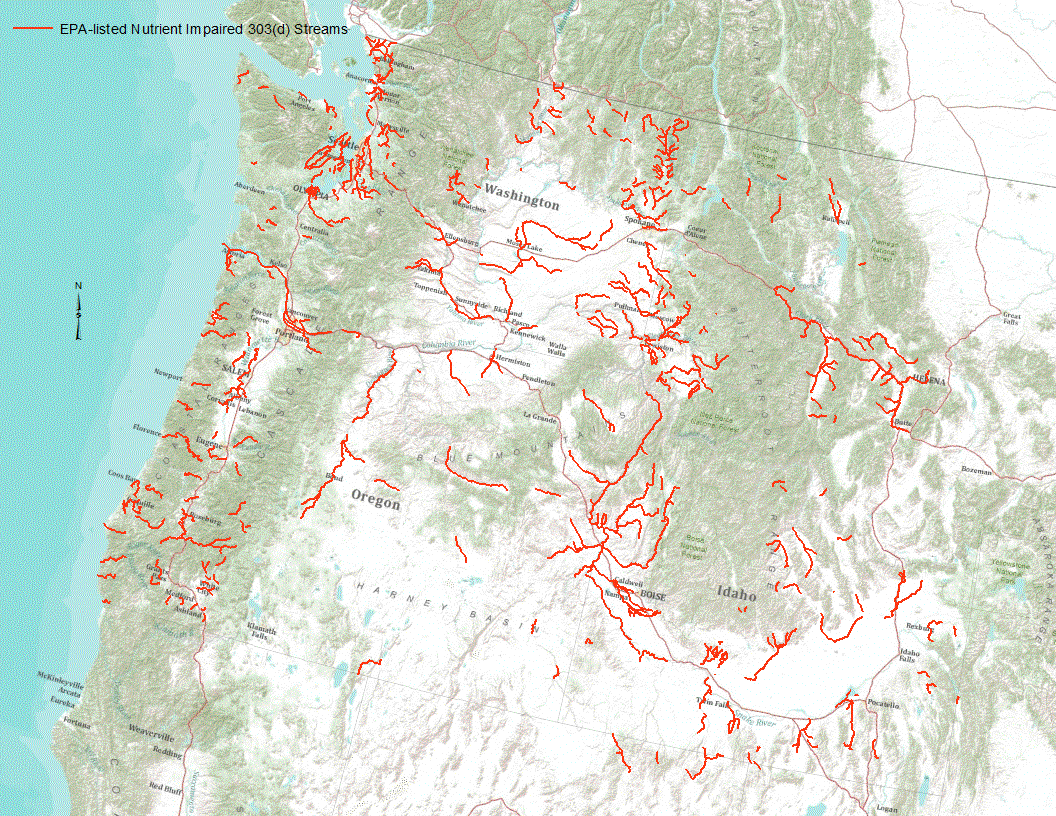
“Under section 303(d) of the 1972 Clean Water Act, states, territories, and authorized tribes are required to develop lists of impaired waters. These impaired waters do not meet water quality standards that states, territories, and authorized tribes have set for them, even after point sources of pollution have installed the minimum required levels of pollution control technology. The law requires that these jurisdictions establish priority rankings for waters on the lists and develop TMDLs for these waters” (U.S. Environmental Protection Agency, 2011). Waterways represented in this data set are a subset of these EPA 303 (d) listed streams that were classified as nutrient impaired. Nutrient impaired streams include...
In this paper we review threshold behaviour in environmental systems, which are often associated with the onset of floods, contamination and erosion events, and other degenerative processes. Key objectives of this review are to a) suggest indicators for detecting threshold behavior, b) discuss their implications for predictability, c) distinguish different forms of threshold behavior and their underlying controls, and d) hypothesise on possible reasons for why threshold behaviour might occur. Threshold behaviour involves a fast qualitative change of either a single process or the response of a system. For elementary phenomena this switch occurs when boundary conditions (e.g., energy inputs) or system states as expressed...
Categories: Publication;
Types: Citation;
Tags: Threshold,
behaviour,
controls,
geo-ecosystems,
human,
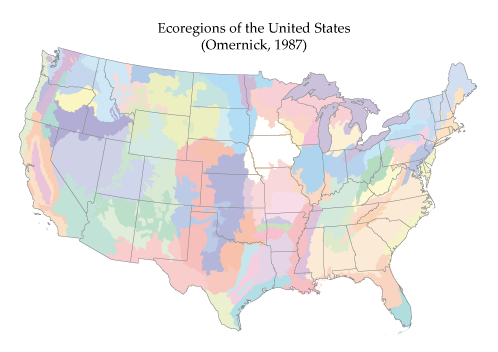
Ecoregions are based on perceived patterns of a combination of causal and integrative factors including land use, land surface form, potential natural vegetation, and soils (Omernik, 1987). This is a copy of the ecoregion coverage of Omernik (1987) with some item names modified. This is NOT the most recent version of the ecoregion definitions, which can be obtained from: Environmental Protection Agency, Western Ecology Division, Corvallis, OR at http://www.epa.gov/wed/pages/ecoregions/level_iii.htm.

This spatial data set was created by the U.S. Geological Survey (USGS) to represent the extent of arid land irrigation in the Pacific Northwest region of the United States (Hydro Region 17; Major River Basin 7 (MRB7)) during 2001.
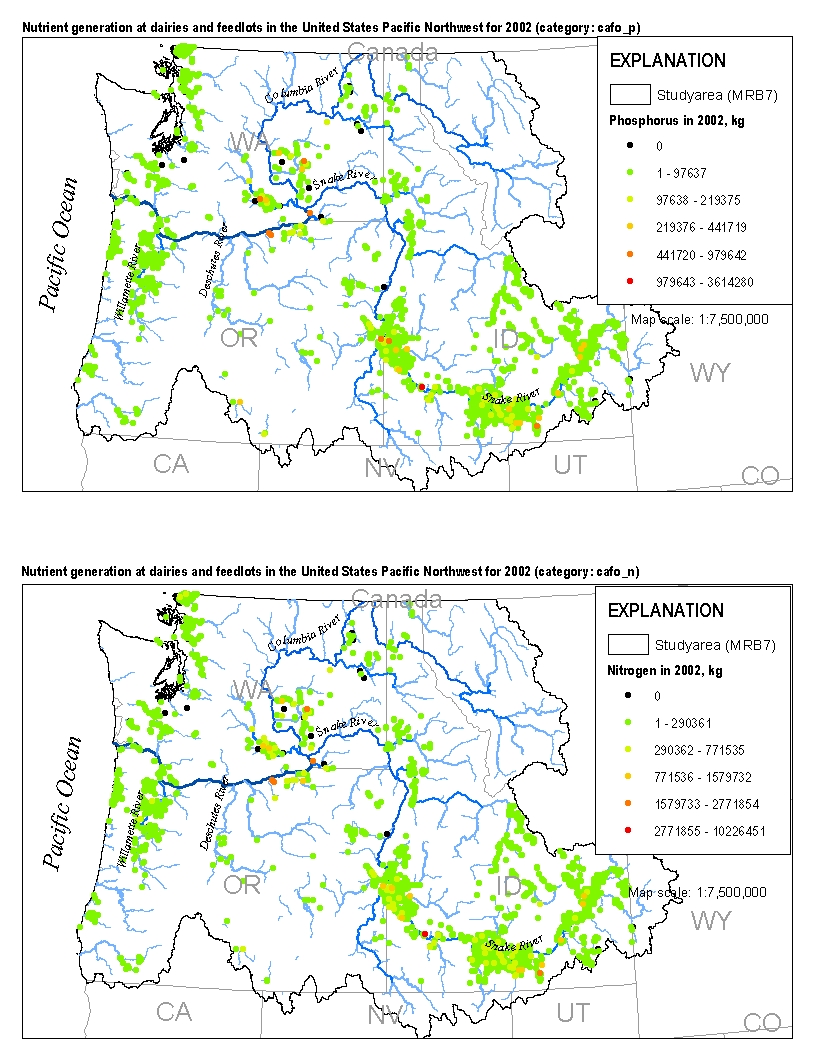
This spatial data set was created by the U.S. Geological Survey (USGS) to represent the amount of nitrogen and phosphorus generated by cattle at dairies and feedlots in the Pacific Northwest region of the United States (Hydro Region 17; Major River Basin 7 (MRB7)) during 2002.
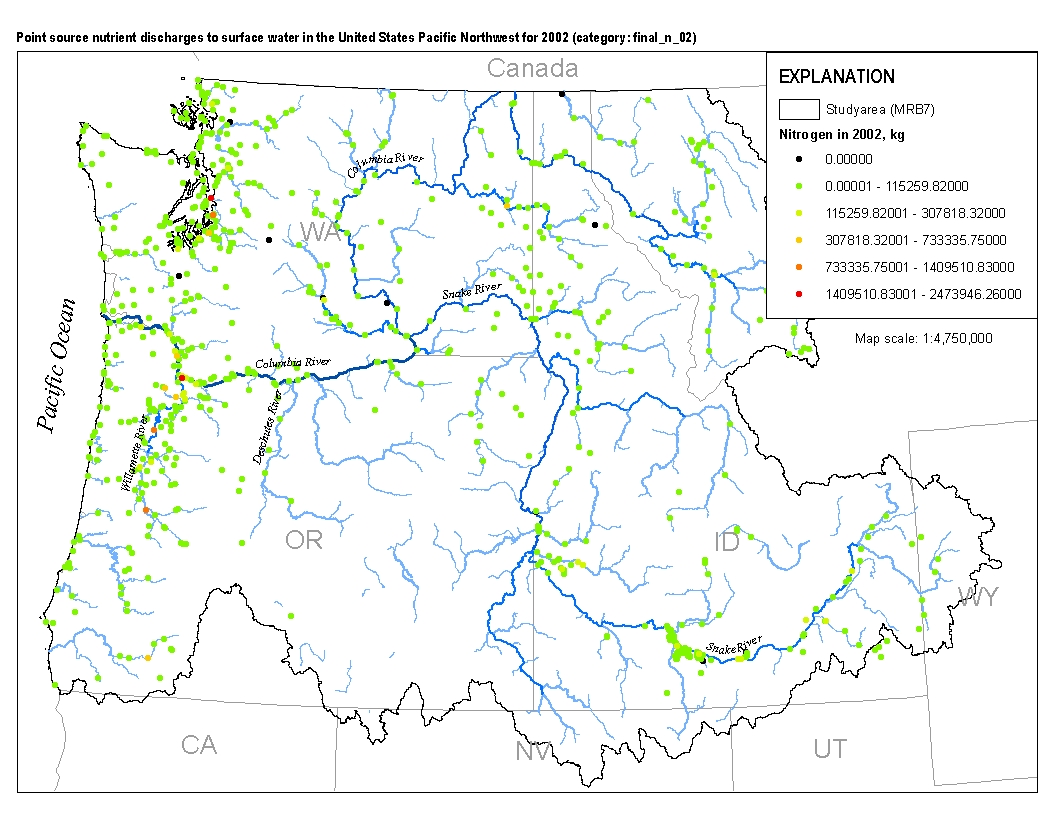
This spatial data set was created by the U.S. Geological Survey (USGS) to represent the amount of total nitrogen and total phosphorus discharged to surface waters in the Pacific Northwest region of the United States (Hydro Region 17; Major River Basin 7 (MRB7)) during 2002 from individual permitted wastewater facilities.
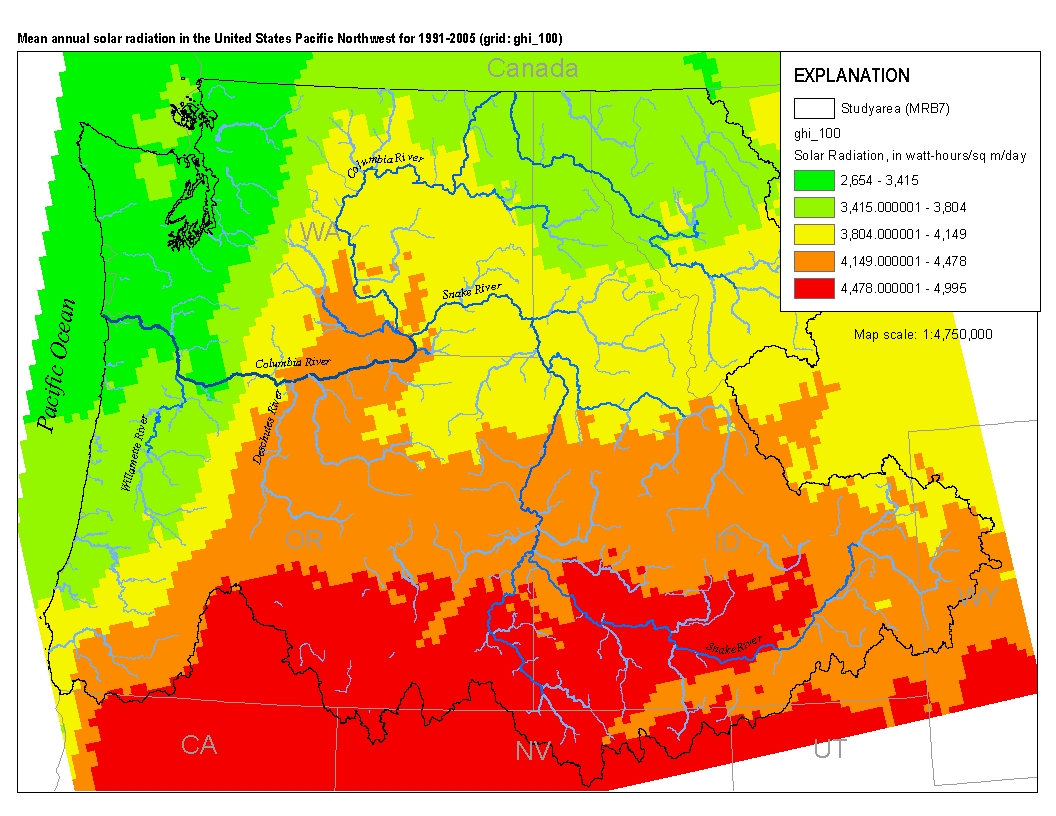
This spatial data set was created by the U.S. Geological Survey (USGS) to represent mean annual solar radiation in the Pacific Northwest region of the United States (Hydro Region 17; Major River Basin 7 (MRB7)) for the period between 1991 and 2005.
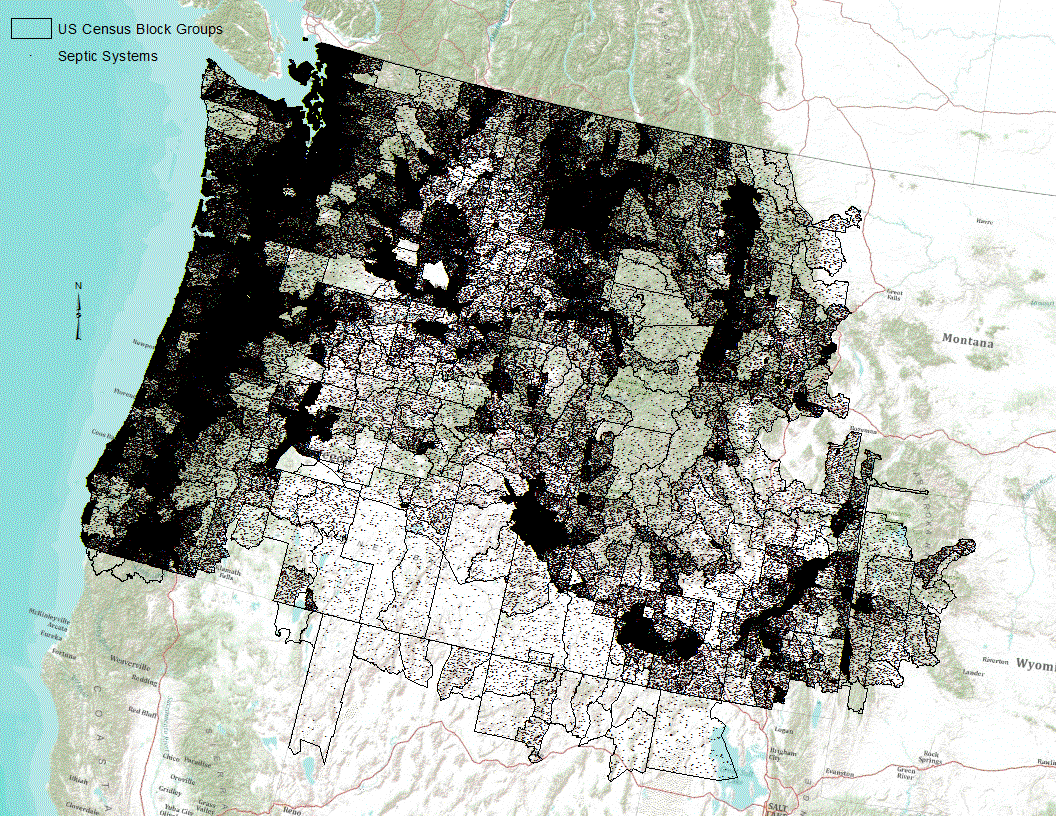
Septic systems are useful for removing and processing human waste. However, they have the potential of leaking or discharging waste into the nearby system and increasing potential contamination of nearby streams. Data represent potential locations of septic sewers in the Pacific Northwest based on extrapolation of 1990 Census tract block group level information.
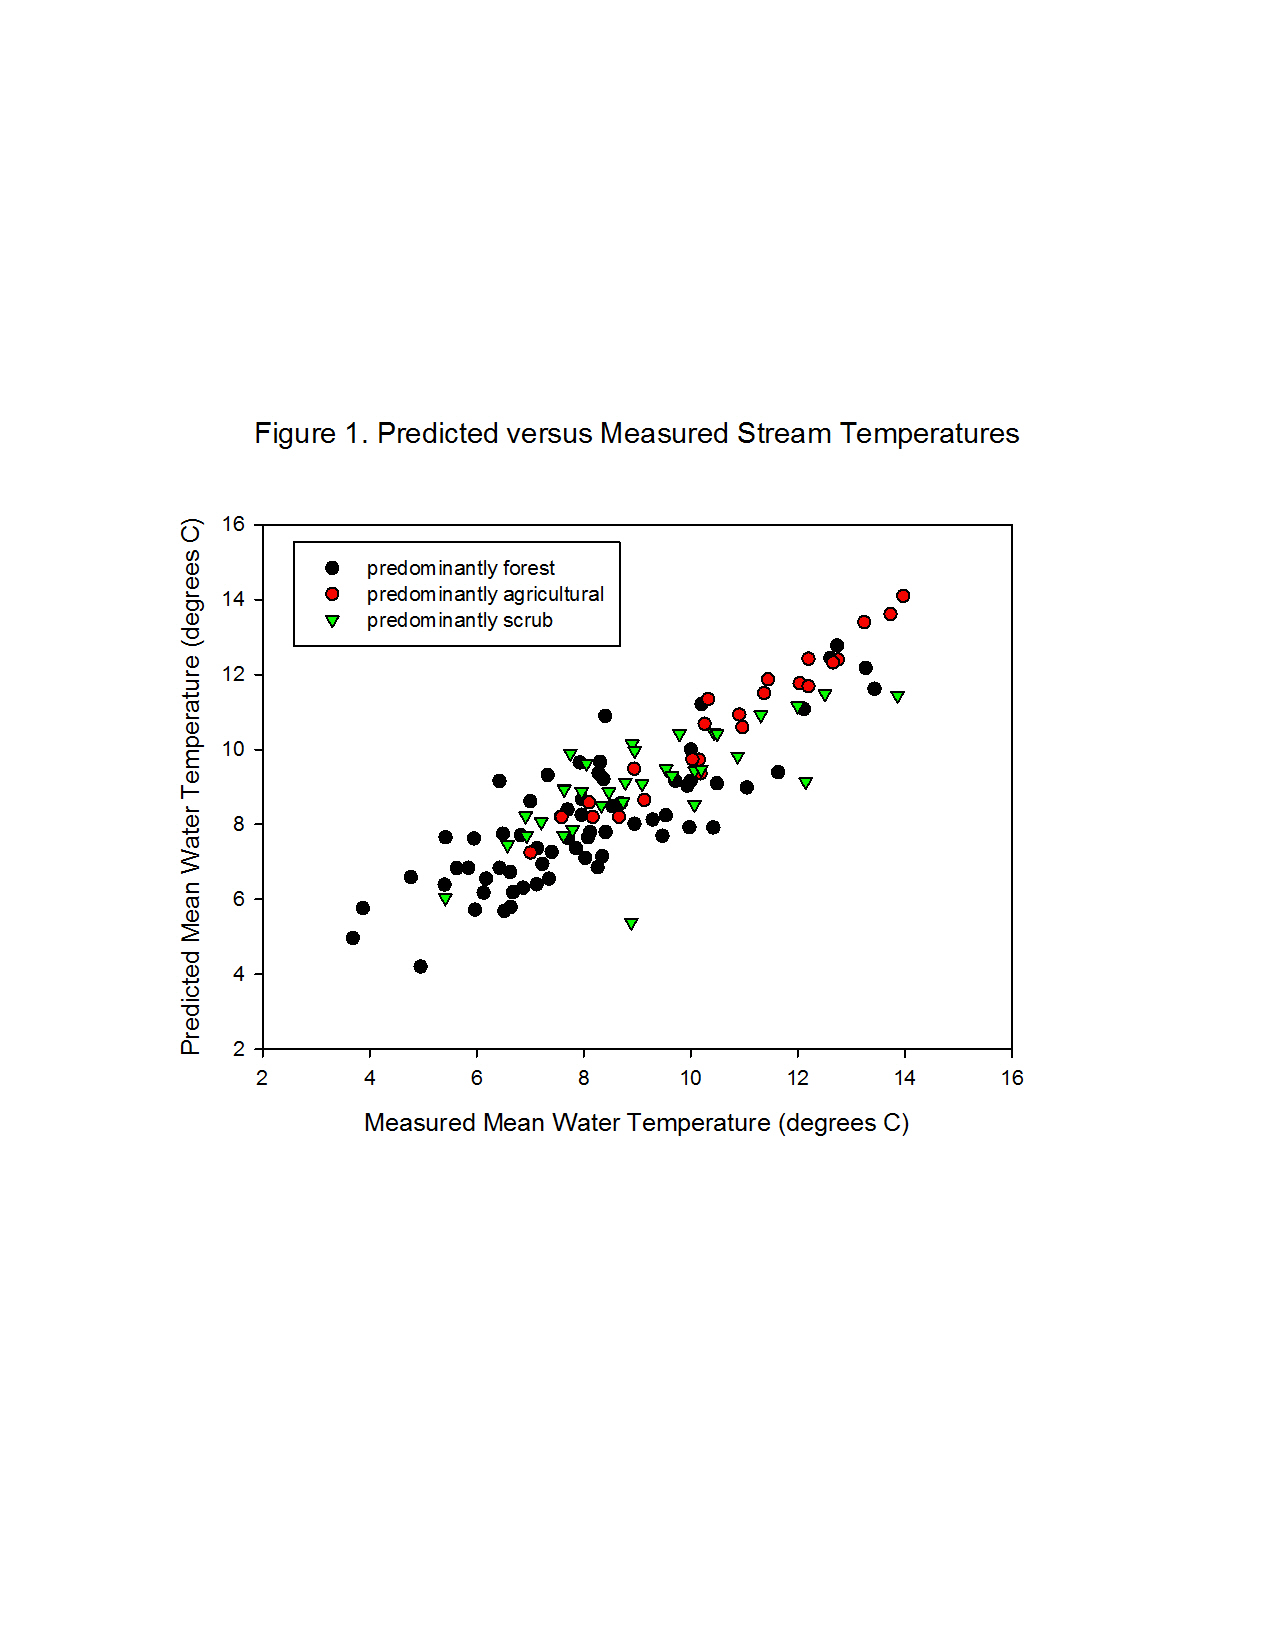
Long-term mean annual water temperature (degrees Celsius) was estimated for the E2RF1 stream network (Brakebill and Terziotti, 2011) located within the Pacific Northwest region of the United States (HUC2 = 17; the Columbia River basin, the Puget Sound watershed, the coastal drainages of Washington and Oregon, and the closed basins in southern Oregon). Multiple linear regressions were used to select reach-scale watershed attributes (explanatory variables) for predicting the long-term mean annual water temperature (dependent variable) at a set of USGS water-quality monitoring stations. The results from the multiple linear regressions were used to predict the long-term mean water temperature for the Pacific Northwest...
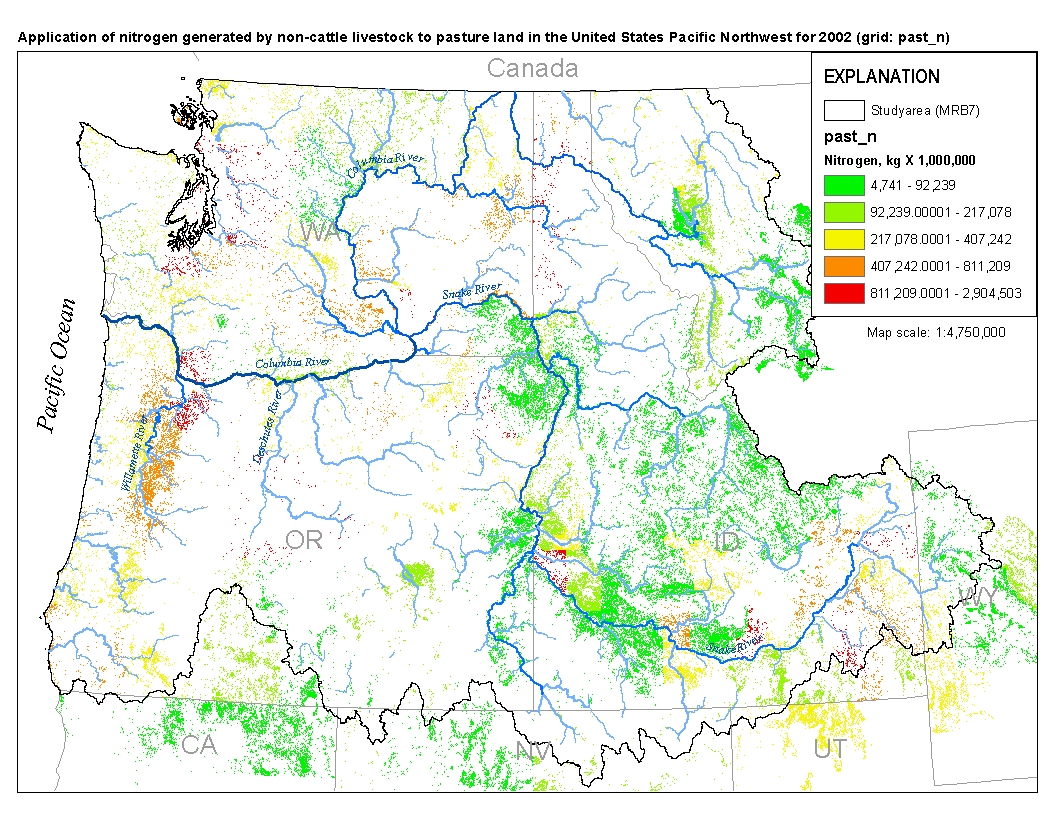
This spatial data set was created by the U.S. Geological Survey (USGS) to represent the amount of nitrogen generated by pastured, non-cattle livestock that was applied to pasture land in the Pacific Northwest region of the United States (Hydro Region 17; Major River Basin 7 (MRB7)) during 2002.
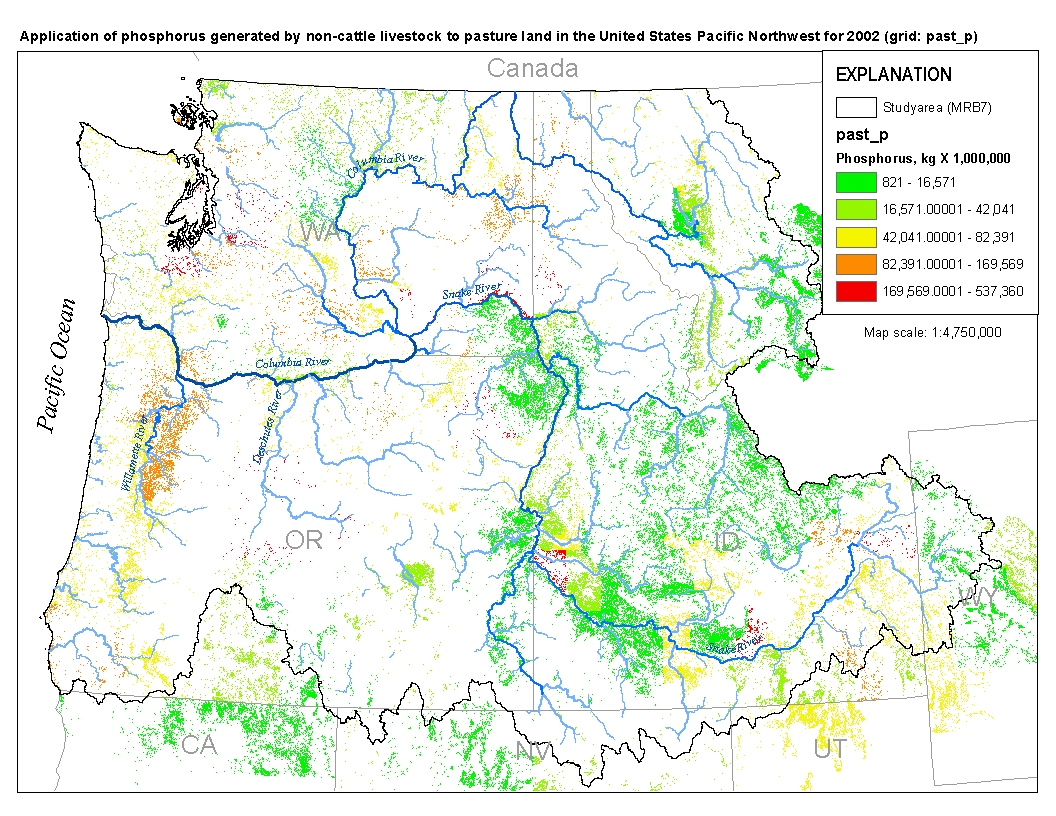
This spatial data set was created by the U.S. Geological Survey (USGS) to represent the amount of phosphorus generated by pastured, non-cattle livestock that was applied to pasture land in the Pacific Northwest region of the United States (Hydro Region 17; Major River Basin 7 (MRB7)) during 2002.
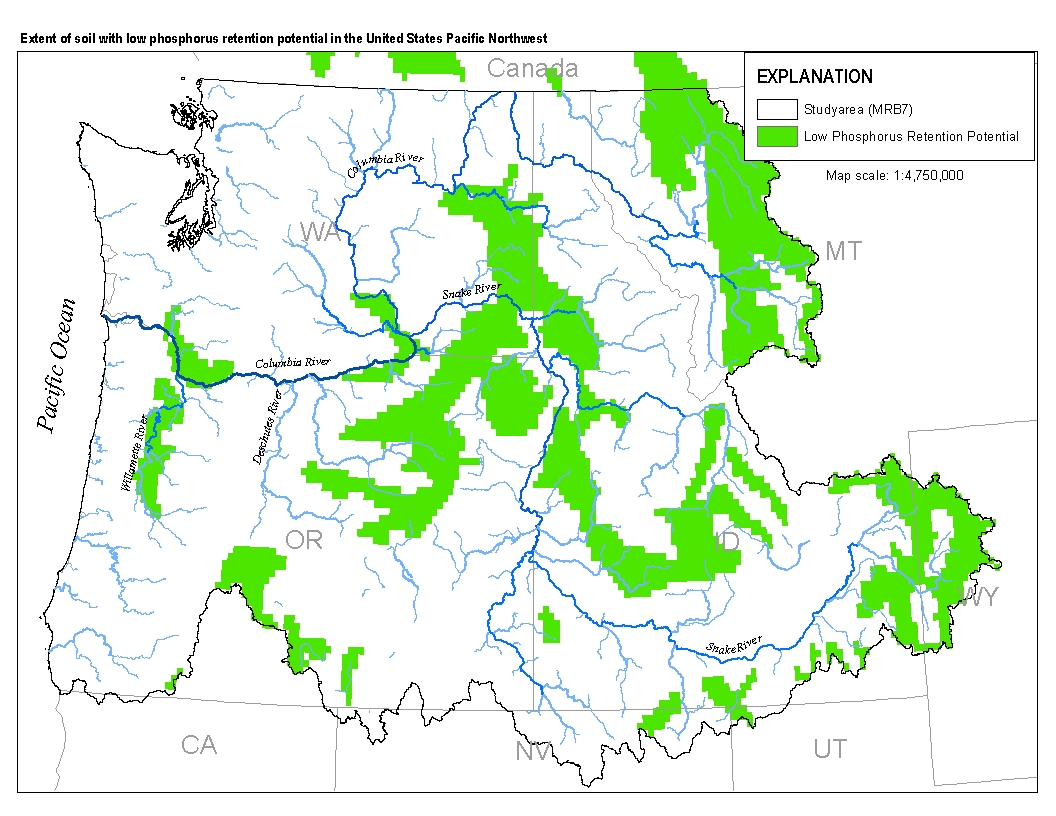
This spatial data set was created by the U.S. Geological Survey (USGS) to represent the extent of soils with low phosphorus retention potential in the Pacific Northwest region of the United States (Hydro Region 17; Major River Basin 7 (MRB7)).
This 1-kilometer raster (grid) dataset for the conterminous United States was created by interpolating base-flow index (BFI) values estimated at U.S. Geological Survey (USGS) streamgages. Base flow is the component of streamflow that can be attributed to ground-water discharge into streams.
This spatial dataset consists of 199 1-kilometer (km) resolution grids depicting estimated agricultural use of 199 pesticides in 1992 for the conterminous United States. Each grid cell value in the national grids of this dataset is the estimated total kilograms (kg) of a pesticide applied to row crops, small grain crops and fallow land, pasture and hay crops, and orchard and vineyard crops within the 1- by 1-km area. Nonagricultural uses of pesticides are not included in this dataset. Of the 199 pesticides represented in the grids, 92 are herbicides, 58 are insecticides, and 32 are fungicides. The remaining 17 grids are composed of the category "other pesticides", which consists of fumigants, growth regulators,...
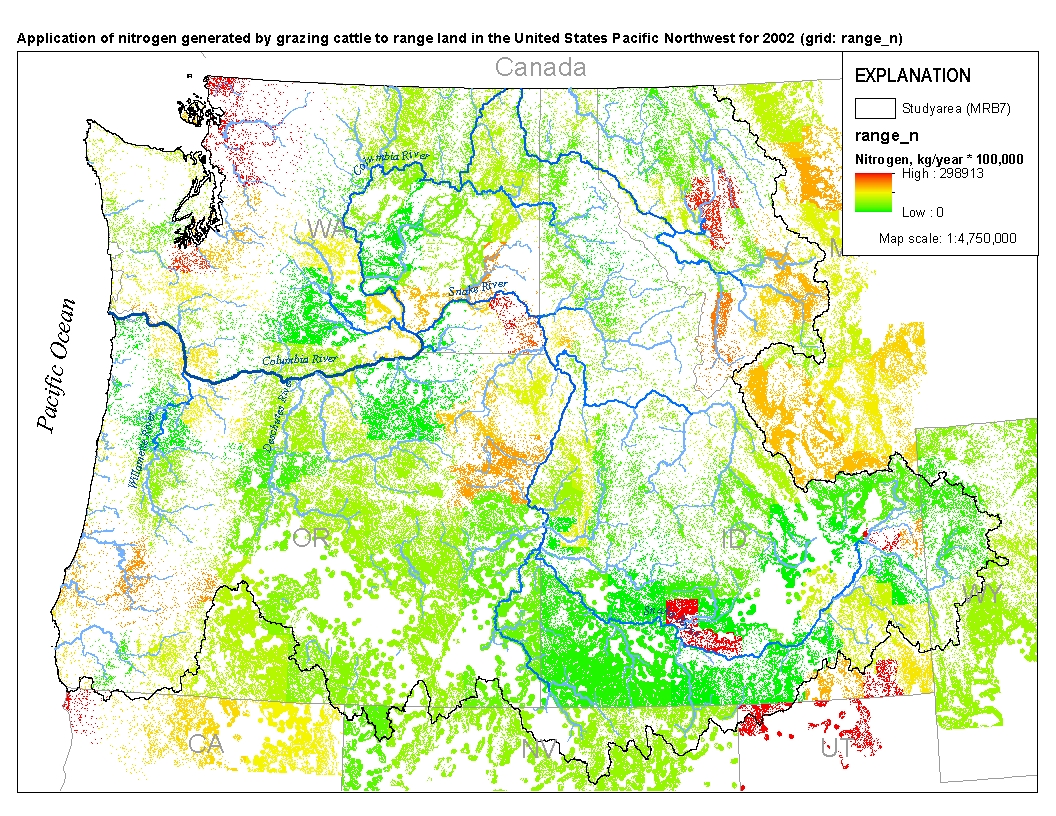
This spatial data set was created by the U.S. Geological Survey (USGS) to represent the amount of nitrogen generated by grazing cattle that was applied to range land in the Pacific Northwest region of the United States (Hydro Region 17; Major River Basin 7 (MRB7)) during 2002.
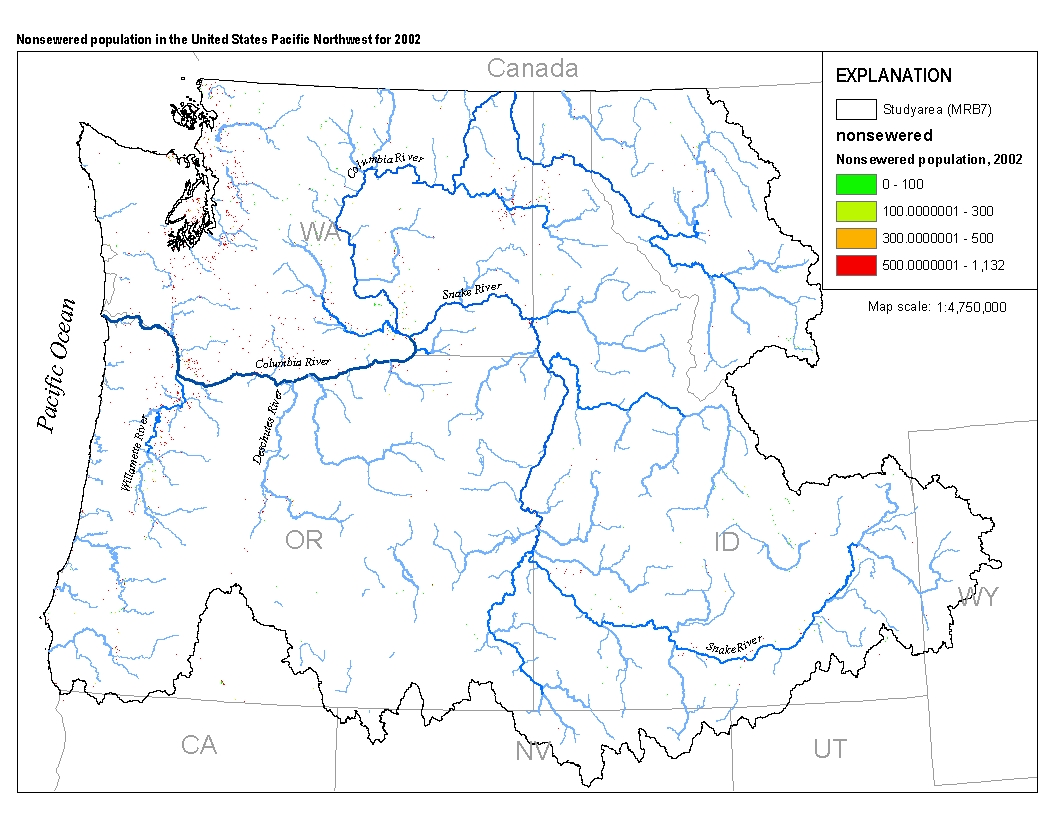
This spatial data set was created by the U.S. Geological Survey (USGS) to represent populations that did not have access to municipal sewer service in the Pacific Northwest region of the United States (Hydro Region 17; Major River Basin 7 (MRB7)) in 2002.
|

|
