Filters: Tags: bolivia (X)
50 results (45ms)|
Filters
Date Range
Extensions (Less) Types (Less)
Contacts (Less)
Categories (Less) Tag Types Tag Schemes
|
This dataset accompanies the publication, 'In situ LA-ICPMS U-Pb dating of cassiterite without a known-age matrix-matched reference material: Examples from worldwide tin deposits spanning the Proterozoic to Tertiary', published in Chemical Geology (https://doi.org/10.1016/j.chemgeo.2018.03.008), which reports a LA-ICPMS analytical procedure for dating cassiterite, a main ore mineral in tin deposits, with no need for an independently dated matrix-matched cassiterite standard.
Categories: Data;
Types: Downloadable,
Map Service,
OGC WFS Layer,
OGC WMS Layer,
OGC WMS Service,
Shapefile;
Tags: Bolivia,
Brazil,
China,
Geochemistry,
Geology, Geophysics, and Geochemistry Science Center,
A seismic hazard model for South America, based on a smoothed (gridded) seismicity model, a subduction model, a crustal fault model, and a ground motion model, has been produced by the U.S. Geological Survey. These models are combined to account for ground shaking from earthquakes on known faults as well as earthquakes on un-modeled faults. This data set represents the results of calculations of hazard curves for a grid of points with a spacing of 0.1 degrees in latitude and longitude. This particular data set is for peak ground acceleration with a 10 percent probability of exceedance in 50 years.
Categories: Data;
Types: Citation,
Downloadable,
Map Service,
OGC WFS Layer,
OGC WMS Layer,
Shapefile;
Tags: Argentina,
Bolivia,
Brazil,
Chile,
Colombia,
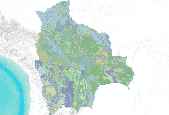
Vegetación de Bolivia 1 : 250 000
A seismic hazard model for South America, based on a smoothed (gridded) seismicity model, a subduction model, a crustal fault model, and a ground motion model, has been produced by the U.S. Geological Survey. These models are combined to account for ground shaking from earthquakes on known faults as well as earthquakes on un-modeled faults. This data set represents the results of calculations of hazard curves for a grid of points with a spacing of 0.1 degrees in latitude and longitude. This particular data set is for horizontal spectral response acceleration for 0.2-second period with a 50 percent probability of exceedance in 50 years.
Categories: Data;
Types: Citation,
Downloadable,
Map Service,
OGC WFS Layer,
OGC WMS Layer,
Shapefile;
Tags: Argentina,
Bolivia,
Brazil,
Chile,
Colombia,
A seismic hazard model for South America, based on a smoothed (gridded) seismicity model, a subduction model, a crustal fault model, and a ground motion model, has been produced by the U.S. Geological Survey. These models are combined to account for ground shaking from earthquakes on known faults as well as earthquakes on un-modeled faults. This data set represents the results of calculations of hazard curves for a grid of points with a spacing of 0.1 degrees in latitude and longitude. This particular data set is for horizontal spectral response acceleration for 1.0-second period with a 10 percent probability of exceedance in 50 years.
Categories: Data;
Types: Citation,
Downloadable,
Map Service,
OGC WFS Layer,
OGC WMS Layer,
Shapefile;
Tags: Argentina,
Bolivia,
Brazil,
Chile,
Colombia,
This data set contains imagery from the National Agriculture Imagery Program (NAIP). The NAIP program is administered by USDA FSA and has been established to support two main FSA strategic goals centered on agricultural production. These are, increase stewardship of America's natural resources while enhancing the environment, and to ensure commodities are procured and distributed effectively and efficiently to increase food security. The NAIP program supports these goals by acquiring and providing ortho imagery that has been collected during the agricultural growing season in the U.S. The NAIP ortho imagery is tailored to meet FSA requirements and is a fundamental tool used to support FSA farm and conservation programs....
A comparison of the 2017 USGS South America seismic hazard model and the 2010 USGS preliminary model was made to see how the models differ. The comparison was made as the ratio of PGA at 10% probability of exceedance in 50 years. The ratio map is included here as a geo-referenced tiff (GeoTIFF). The gridded data for the 2017 PGA at 10% probability can be found here, while the gridded data for the 2010 PGA at 10% probability can be found in the zip archive that can be downloaded using a link on this page.
Categories: Data;
Types: Citation,
Downloadable,
GeoTIFF,
Map Service,
OGC WFS Layer,
OGC WMS Layer,
Raster,
Shapefile;
Tags: Argentina,
Bolivia,
Brazil,
Chile,
Colombia,
Maximum considered earthquake geometric mean peak ground acceleration maps (MCEG) are for assessment of the potential for liquefaction and soil strength loss, as well as for determination of lateral earth pressures in the design of basement and retaining walls. The maps are derived from the USGS seismic hazard maps in accordance with the site-specific ground-motion procedures of the NEHRP Recommended Seismic Provisions for New Building and Other Structures and the ASCE Minimum Design Loads for Buildings and Other Structures (also known as the ASCE 7 Standard; ASCE, 2016). The MCEG ground motions are taken as the lesser of probabilistic and deterministic values, as explained in the Provisions. The gridded probabilistic...
Categories: Data;
Types: Citation,
Downloadable,
Map Service,
OGC WFS Layer,
OGC WMS Layer,
Shapefile;
Tags: Argentina,
Bolivia,
Brazil,
Chile,
Colombia,
A comparison of the 2017 USGS South America seismic hazard model and the Global Seismic Hazard Assessment Program (GSHAP) model was made to see how the models differ. The comparison was made as the ratio of PGA at 10% probability of exceedance in 50 years. The ratio map is included here as a geo-referenced tiff (GeoTIFF). The gridded data for the 2017 PGA at 10% probability can be found here, while the GSHAP data can be found here. Shedlock, K.M., Giardini, Domenico, Grünthal, Gottfried, and Zhang, Peizhan, 2000, The GSHAP Global Seismic Hazar Map, Sesimological Research Letters, 71, 679-686. https://doi.org/10.1785/gssrl.71.6.679
Categories: Data;
Types: Citation,
Downloadable,
GeoTIFF,
Map Service,
OGC WFS Layer,
OGC WMS Layer,
Raster,
Shapefile;
Tags: Argentina,
Bolivia,
Brazil,
Chile,
Colombia,
USGS Historical Quadrangle in GeoPDF.
USGS Historical Quadrangle in GeoPDF.
A seismic hazard model for South America, based on a smoothed (gridded) seismicity model, a subduction model, a crustal fault model, and a ground motion model, has been produced by the U.S. Geological Survey. These models are combined to account for ground shaking from earthquakes on known faults as well as earthquakes on un-modeled faults. This data set represents the hazard curves for a grid of points with a spacing of 0.1 degrees in latitude and longitude. It represents the annual rate of exceedance versus 0.2-second spectral response acceleration.
A seismic hazard model for South America, based on a smoothed (gridded) seismicity model, a subduction model, a crustal fault model, and a ground motion model, has been produced by the U.S. Geological Survey. These models are combined to account for ground shaking from earthquakes on known faults as well as earthquakes on un-modeled faults. This data set represents the results of calculations of hazard curves for a grid of points with a spacing of 0.1 degrees in latitude and longitude. This particular data set is for peak ground acceleration with a 2 percent probability of exceedance in 50 years.
Categories: Data;
Types: Citation,
Downloadable,
Map Service,
OGC WFS Layer,
OGC WMS Layer,
Shapefile;
Tags: Argentina,
Bolivia,
Brazil,
Chile,
Colombia,
A seismic hazard model for South America, based on a smoothed (gridded) seismicity model, a subduction model, a crustal fault model, and a ground motion model, has been produced by the U.S. Geological Survey. These models are combined to account for ground shaking from earthquakes on known faults as well as earthquakes on un-modeled faults. This data set represents the results of calculations of hazard curves for a grid of points with a spacing of 0.1 degrees in latitude and longitude. This particular data set is for Modified Mercalli Intensity with a 50 percent probability of exceedance in 50 years. The maps and data were derived from PGA ground-motion conversions of Worden et al. (2012), and include soil amplification...
Categories: Data;
Types: Citation,
Downloadable,
GeoTIFF,
Map Service,
OGC WFS Layer,
OGC WMS Layer,
Raster,
Shapefile;
Tags: Argentina,
Bolivia,
Brazil,
Chile,
Colombia,
A seismic hazard model for South America, based on a smoothed (gridded) seismicity model, a subduction model, a crustal fault model, and a ground motion model, has been produced by the U.S. Geological Survey. These models are combined to account for ground shaking from earthquakes on known faults as well as earthquakes on un-modeled faults. This data set represents the results of calculations of hazard curves for a grid of points with a spacing of 0.1 degrees in latitude and longitude. This particular data set is for horizontal spectral response acceleration for 0.2-second period with a 2 percent probability of exceedance in 50 years.
Categories: Data;
Types: Citation,
Downloadable,
Map Service,
OGC WFS Layer,
OGC WMS Layer,
Shapefile;
Tags: Argentina,
Bolivia,
Brazil,
Chile,
Colombia,
This data set contains imagery from the National Agriculture Imagery Program (NAIP). The NAIP program is administered by USDA FSA and has been established to support two main FSA strategic goals centered on agricultural production. These are increase stewardship of America's natural resources while enhancing the environment, and to ensure commodities are procured and distributed effectively and efficiently to increase food security. The NAIP program supports these goals by acquiring and providing ortho imagery that has been collected during the agricultural growing season in the U.S. The NAIP ortho imagery is tailored to meet FSA requirements and is a fundamental tool used to support FSA farm and conservation programs....
Risk-targeted maximum considered earthquake ground acceleration maps (MCER) are for the design of buildings and other structures. The maps are derived from the USGS seismic hazard maps in accordance with the site-specific ground-motion procedures of the NEHRP Recommended Seismic Provisions for New Building and Other Structures and the ASCE Minimum Design Loads for Buildings and Other Structures (also known as the ASCE 7 Standard; ASCE, 2016). The MCER ground motions are taken as the lesser of probabilistic and deterministic values, as explained in the Provisions. The gridded probabilistic and deterministic values for 0.2-second spectral response acceleration are available here.
Categories: Data;
Types: Citation,
Downloadable,
Map Service,
OGC WFS Layer,
OGC WMS Layer,
Shapefile;
Tags: Argentina,
Bolivia,
Brazil,
Chile,
Colombia,
A seismic hazard model for South America, based on a smoothed (gridded) seismicity model, a subduction model, a crustal fault model, and a ground motion model, has been produced by the U.S. Geological Survey. These models are combined to account for ground shaking from earthquakes on known faults as well as earthquakes on un-modeled faults. This data set represents the results of calculations of hazard curves for a grid of points with a spacing of 0.1 degrees in latitude and longitude. This particular data set is for horizontal spectral response acceleration for 1.0-second period with a 50 percent probability of exceedance in 50 years.
Categories: Data;
Types: Citation,
Downloadable,
Map Service,
OGC WFS Layer,
OGC WMS Layer,
Shapefile;
Tags: Argentina,
Bolivia,
Brazil,
Chile,
Colombia,
This data set contains imagery from the National Agriculture Imagery Program (NAIP). The NAIP program is administered by USDA FSA and has been established to support two main FSA strategic goals centered on agricultural production. These are, increase stewardship of America's natural resources while enhancing the environment, and to ensure commodities are procured and distributed effectively and efficiently to increase food security. The NAIP program supports these goals by acquiring and providing ortho imagery that has been collected during the agricultural growing season in the U.S. The NAIP ortho imagery is tailored to meet FSA requirements and is a fundamental tool used to support FSA farm and conservation programs....
South America is part of Region 6 (Central and South America) for the World Energy Assessment. South America was divided into 107 geologic provinces as background for prioritization and assessment of undiscovered oil and gas resources. The boundaries of geologic provinces are required for the assessment as oil and gas. Data must be allocated to a geographic entity so that decisions can be made as to which provinces are priority for the assessment. Many sources of geologic information were used to define the province boundaries in South America, and several versions of the map were reviewed. Of the 107 geologic provinces defined in South America, about 40 have had some oil and gas production to date.
Categories: Data,
pre-SM502.8;
Types: Downloadable,
Map Service,
OGC WFS Layer,
OGC WMS Layer,
Shapefile;
Tags: AR,
Acre Basin, Province 6042,
Altiplano Basin, Province 6065,
Amazonas Basin, Province 6012,
Andean Province 6006,
|

|
