Filters: Tags: Sonoma County (X)
287 results (64ms)|
Filters
Date Range
Extensions Types Contacts
Categories Tag Types
|
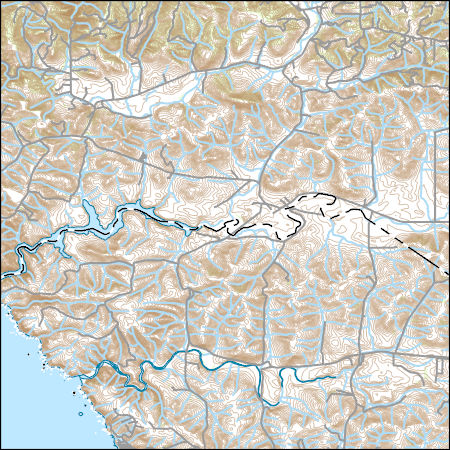
Layers of geospatial data include contours, boundaries, land cover, hydrography, roads, transportation, geographic names, structures, and other selected map features.
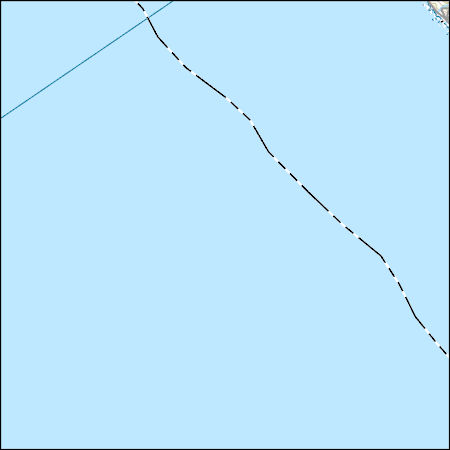
Layers of geospatial data include contours, boundaries, land cover, hydrography, roads, transportation, geographic names, structures, and other selected map features.
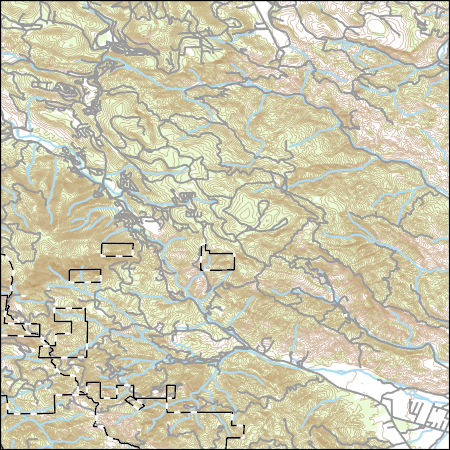
Layers of geospatial data include contours, boundaries, land cover, hydrography, roads, transportation, geographic names, structures, and other selected map features.
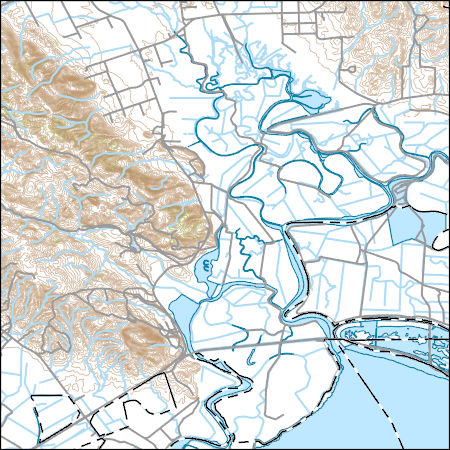
Layers of geospatial data include contours, boundaries, land cover, hydrography, roads, transportation, geographic names, structures, and other selected map features.
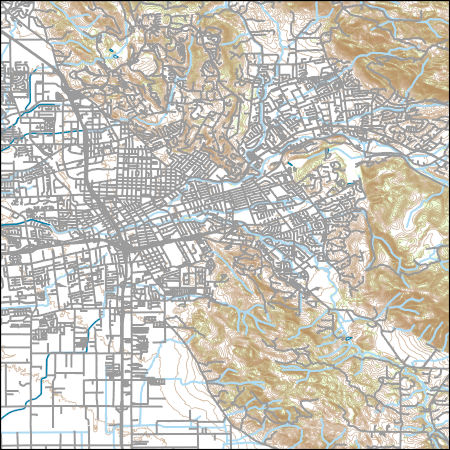
Layers of geospatial data include contours, boundaries, land cover, hydrography, roads, transportation, geographic names, structures, and other selected map features.

These data were released prior to the October 1, 2016 effective date for the USGS’s policy dictating the review, approval, and release of scientific data as referenced in USGS Survey Manual Chapter 502.8 Fundamental Science Practices: Review and Approval of Scientific Data for Release. This digital dataset contains the virtual wells used for urban (municipal and industrial use) pumpage for the Central Valley Hydrologic Model (CVHM). The Central Valley encompasses an approximate 50,000 square-kilometer region of California. The complex hydrologic system of the Central Valley is simulated using the U.S. Geological Survey (USGS) numerical modeling code MODFLOW-FMP (Schmid and others, 2006). This application is referred...
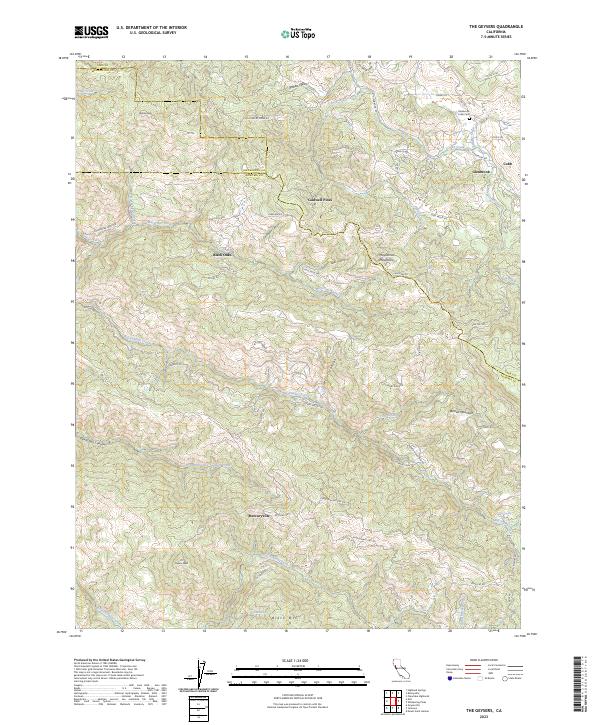
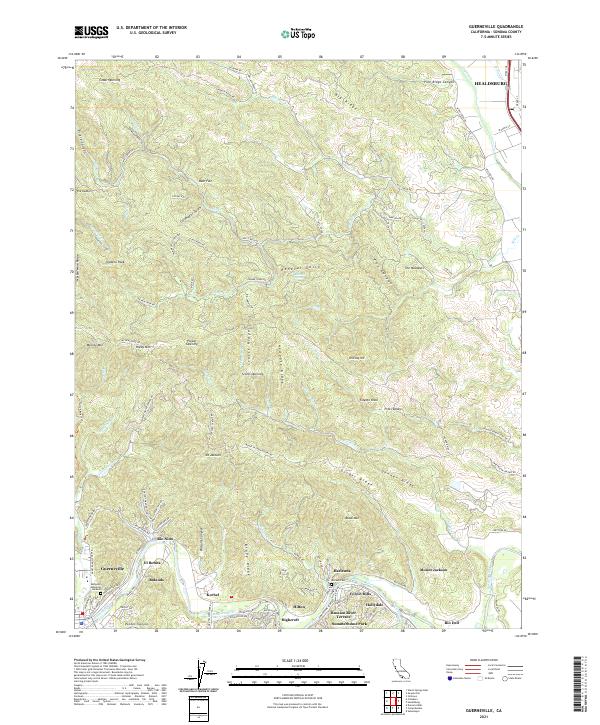
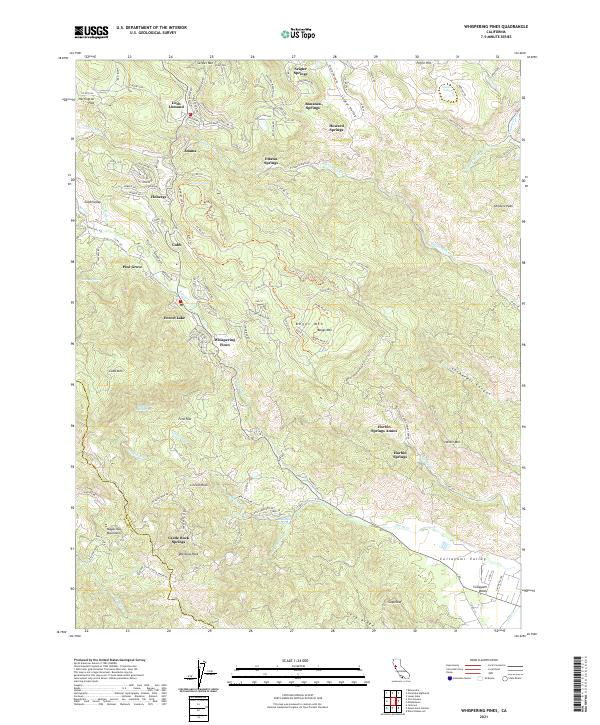
Layered geospatial PDF 7.5 Minute Quadrangle Map. Layers of geospatial data include orthoimagery, roads, grids, geographic names, elevation contours, hydrography, and other selected map features. This map is derived from GIS (geospatial information system) data. It represents a repackaging of GIS data in traditional map form, not creation of new information. The geospatial data in this map are from selected National Map data holdings and other government sources.
This dataset consists of 42 magnetotelluric (MT) stations collected in 2017 in the Northwest Geysers, CA. The U.S. Geological Survey acquired these data as part of a project to image the heat source in the Northwest Geysers. Support was from the U.S. Geological Survey's Volcano Hazards Program.
This dataset consists of 42 magnetotelluric (MT) stations collected in 2017 in the Northwest Geysers, CA. The U.S. Geological Survey acquired these data as part of a project to image the heat source in the Northwest Geysers. Support was from the U.S. Geological Survey's Volcano Hazards Program.
The 'Black Oak Quicksilver Prospect' file is part of the Grover Heinrichs mining collection. Grover was the Vice President of Heinrichs GEOEXploration, located in Tucson, Arizona. The collection contains over 1,400 folders including economic geology reports, maps, photos, correspondence, drill logs and other related materials. The focus of much of the information is on the western United States, particularly Arizona, but the collection also includes files on mining activity throughout the United States, foreign countries, and 82 mineral commodities.
Categories: Data;
Tags: California,
Dataset,
Sonoma County,
United States,
geoscientificInformation,
The 'Cummings Prop. (Jamestown Sand and Gravel)' file is part of the Grover Heinrichs mining collection. Grover was the Vice President of Heinrichs GEOEXploration, located in Tucson, Arizona. The collection contains over 1,400 folders including economic geology reports, maps, photos, correspondence, drill logs and other related materials. The focus of much of the information is on the western United States, particularly Arizona, but the collection also includes files on mining activity throughout the United States, foreign countries, and 82 mineral commodities.
Categories: Data;
Tags: California,
Dataset,
Sonoma County,
United States,
geoscientificInformation,
This dataset consists of 42 magnetotelluric (MT) stations collected in 2017 in the Northwest Geysers, CA. The U.S. Geological Survey acquired these data as part of a project to image the heat source in the Northwest Geysers. Support was from the U.S. Geological Survey's Volcano Hazards Program.
This dataset consists of 42 magnetotelluric (MT) stations collected in 2017 in the Northwest Geysers, CA. The U.S. Geological Survey acquired these data as part of a project to image the heat source in the Northwest Geysers. Support was from the U.S. Geological Survey's Volcano Hazards Program.
This dataset consists of 42 magnetotelluric (MT) stations collected in 2017 in the Northwest Geysers, CA. The U.S. Geological Survey acquired these data as part of a project to image the heat source in the Northwest Geysers. Support was from the U.S. Geological Survey's Volcano Hazards Program.
This dataset consists of 42 magnetotelluric (MT) stations collected in 2017 in the Northwest Geysers, CA. The U.S. Geological Survey acquired these data as part of a project to image the heat source in the Northwest Geysers. Support was from the U.S. Geological Survey's Volcano Hazards Program.
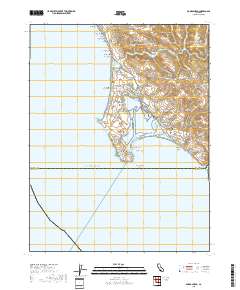
Layered geospatial PDF 7.5 Minute Quadrangle Map. Layers of geospatial data include orthoimagery, roads, grids, geographic names, elevation contours, hydrography, and other selected map features. This map is derived from GIS (geospatial information system) data. It represents a repackaging of GIS data in traditional map form, not creation of new information. The geospatial data in this map are from selected National Map data holdings and other government sources.
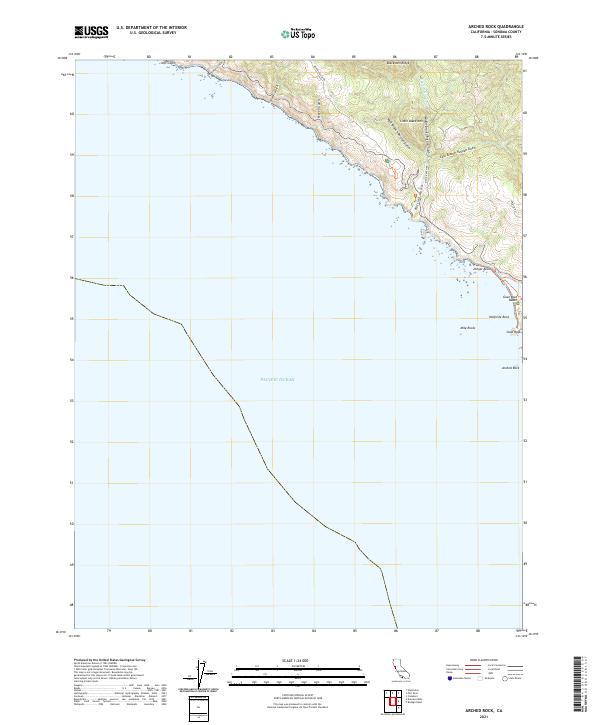
Layered geospatial PDF 7.5 Minute Quadrangle Map. Layers of geospatial data include orthoimagery, roads, grids, geographic names, elevation contours, hydrography, and other selected map features. This map is derived from GIS (geospatial information system) data. It represents a repackaging of GIS data in traditional map form, not creation of new information. The geospatial data in this map are from selected National Map data holdings and other government sources.
Layered geospatial PDF 7.5 Minute Quadrangle Map. Layers of geospatial data include orthoimagery, roads, grids, geographic names, elevation contours, hydrography, and other selected map features. This map is derived from GIS (geospatial information system) data. It represents a repackaging of GIS data in traditional map form, not creation of new information. The geospatial data in this map are from selected National Map data holdings and other government sources.
Layered geospatial PDF 7.5 Minute Quadrangle Map. Layers of geospatial data include orthoimagery, roads, grids, geographic names, elevation contours, hydrography, and other selected map features. This map is derived from GIS (geospatial information system) data. It represents a repackaging of GIS data in traditional map form, not creation of new information. The geospatial data in this map are from selected National Map data holdings and other government sources.
Layered geospatial PDF 7.5 Minute Quadrangle Map. Layers of geospatial data include orthoimagery, roads, grids, geographic names, elevation contours, hydrography, and other selected map features. This map is derived from GIS (geospatial information system) data. It represents a repackaging of GIS data in traditional map form, not creation of new information. The geospatial data in this map are from selected National Map data holdings and other government sources.
|

|
