Filters
Date Range
Types
Contacts
Tag Types
Tag Schemes
|
This data set contains imagery from the National Agriculture Imagery Program (NAIP). The NAIP program is administered by USDA FSA and has been established to support two main FSA strategic goals centered on agricultural production. These are increase stewardship of America's natural resources while enhancing the environment, and to ensure commodities are procured and distributed effectively and efficiently to increase food security. The NAIP program supports these goals by acquiring and providing ortho imagery that has been collected during the agricultural growing season in the U.S. The NAIP ortho imagery is tailored to meet FSA requirements and is a fundamental tool used to support FSA farm and conservation programs....
Types: Citation;
Tags: 3.75 x 3.75 minute,
3507705,
37065,
Aerial Compliance,
Compliance, All tags...
Digital Ortho rectified Image,
Downloadable Data,
EDGECOMBE CO NC FSA,
Edgecombe,
JPEG 2000,
JPEG2000,
NAIP,
NC,
NC065,
Ortho Rectification,
Orthoimagery,
Quarter Quadrangle,
SPEED,
SPEED, NW,
USDA National Agriculture Imagery Program (NAIP),
farming,
imageryBaseMapsEarthCover, Fewer tags
This data set contains imagery from the National Agriculture Imagery Program (NAIP). The NAIP program is administered by USDA FSA and has been established to support two main FSA strategic goals centered on agricultural production. These are increase stewardship of America's natural resources while enhancing the environment, and to ensure commodities are procured and distributed effectively and efficiently to increase food security. The NAIP program supports these goals by acquiring and providing ortho imagery that has been collected during the agricultural growing season in the U.S. The NAIP ortho imagery is tailored to meet FSA requirements and is a fundamental tool used to support FSA farm and conservation programs....
Types: Citation;
Tags: 18019,
3.75 x 3.75 minute,
3808534,
Aerial Compliance,
CLARK CO IN FSA, All tags...
Clark,
Compliance,
Digital Ortho rectified Image,
Downloadable Data,
IN,
IN019,
JPEG 2000,
JPEG2000,
NAIP,
Ortho Rectification,
Orthoimagery,
Quarter Quadrangle,
SPEED,
SPEED, NW,
USDA National Agriculture Imagery Program (NAIP),
farming,
imageryBaseMapsEarthCover, Fewer tags

Annual average offshore wind speed for the Great Lakes (Indiana, Illinois, Michigan, Minnesota, New York, Ohio, Pennsylvania, and Wisconsin) at a 90 meter height. Available from the National Renewable Energy Laboratory (NREL) at http://www.nrel.gov/renewable_resources/. This dataset was last updated on 8/23/2010.

Annual average offshore wind speed for the Pacific Coast (California, Oregon, and Washington) at a 90 meter height. Available from NREL at http://www.nrel.gov/renewable_resources/ . This version was last updated on 8/23/2010.
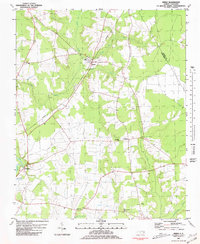
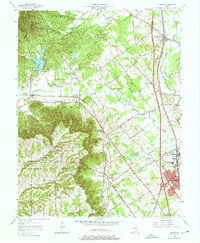
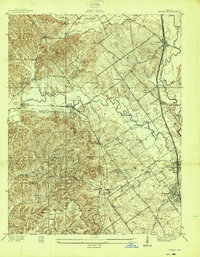
USGS Historical Quadrangle in GeoPDF.
Tags: 7.5 x 7.5 minute,
Downloadable Data,
GeoPDF,
GeoTIFF,
Historical Topographic Maps, All tags...
Historical Topographic Maps 7.5 x 7.5 Minute Map Series,
Map,
NC,
Speed,
imageryBaseMapsEarthCover, Fewer tags
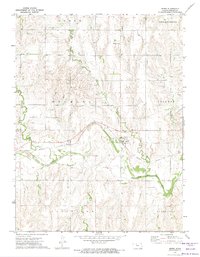
USGS Historical Quadrangle in GeoPDF.
Tags: 7.5 x 7.5 minute,
Downloadable Data,
GeoPDF,
GeoTIFF,
Historical Topographic Maps, All tags...
Historical Topographic Maps 7.5 x 7.5 Minute Map Series,
KS,
Map,
Speed,
imageryBaseMapsEarthCover, Fewer tags

These data were compiled here to fit various versions of Bayesian population models and compare their performance, primarily the time required to make inferences using different softwares and versions of code. The humpback chub data were collected by US Geological Survey and US Fish and Wildlife service in the Colorado and Little Colorado Rivers from April 2009 to October 2017. Adult fish were captured using hoop nets and electro-fishing, measured for total length and given individual marks using passive integrated transponders that were scanned when fish were recaptured. The other three datasets were collected by US Forest Service. Owl data for the N-occupancy model was collected between 1990 and 2015. Owl data...
Tags: Aquatic Biology,
Arizona,
Bayesian,
Chiricahua Mountains,
Colorado River, All tags...
Ecology,
Forestry,
Geography,
Information Sciences,
Little Colorado River,
Oregon,
Tyee,
Tyee study area,
USGS Science Data Catalog (SDC),
Wildlife Biology,
biota,
discrete,
ecological models,
ecology,
marginalization,
mark-recapture,
occupancy,
sky islands,
speed, Fewer tags
This data set contains imagery from the National Agriculture Imagery Program (NAIP). The NAIP program is administered by USDA FSA and has been established to support two main FSA strategic goals centered on agricultural production. These are increase stewardship of America's natural resources while enhancing the environment, and to ensure commodities are procured and distributed effectively and efficiently to increase food security. The NAIP program supports these goals by acquiring and providing ortho imagery that has been collected during the agricultural growing season in the U.S. The NAIP ortho imagery is tailored to meet FSA requirements and is a fundamental tool used to support FSA farm and conservation programs....
Types: Citation;
Tags: 3.75 x 3.75 minute,
3507705,
37065,
Aerial Compliance,
Compliance, All tags...
Digital Ortho rectified Image,
Downloadable Data,
EDGECOMBE CO NC FSA,
Edgecombe,
JPEG 2000,
JPEG2000,
NAIP,
NC,
NC065,
Ortho Rectification,
Orthoimagery,
Quarter Quadrangle,
SPEED,
SPEED, SE,
USDA National Agriculture Imagery Program (NAIP),
farming,
imageryBaseMapsEarthCover, Fewer tags

Annual average offshore wind speed for the Pacific Coast (California, Oregon, and Washington) at a 90 meter height. Available from NREL at http://www.nrel.gov/renewable_resources/ . This version was last updated on 8/23/2010.
This data set contains imagery from the National Agriculture Imagery Program (NAIP). The NAIP program is administered by USDA FSA and has been established to support two main FSA strategic goals centered on agricultural production. These are, increase stewardship of America's natural resources while enhancing the environment, and to ensure commodities are procured and distributed effectively and efficiently to increase food security. The NAIP program supports these goals by acquiring and providing ortho imagery that has been collected during the agricultural growing season in the U.S. The NAIP ortho imagery is tailored to meet FSA requirements and is a fundamental tool used to support FSA farm and conservation programs....
Types: Citation;
Tags: 20147,
3.75 x 3.75 minute,
3909921,
Aerial Compliance,
Compliance, All tags...
Digital Ortho rectified Image,
Downloadable Data,
JPEG2000,
KS,
KS147,
NAIP,
Ortho Rectification,
Orthoimagery,
PHILLIPS CO KS FSA,
Phillips,
Quarter Quadrangle,
SPEED,
SPEED, NE,
USDA National Agriculture Imagery Program (NAIP),
farming, Fewer tags
This data set contains imagery from the National Agriculture Imagery Program (NAIP). The NAIP program is administered by USDA FSA and has been established to support two main FSA strategic goals centered on agricultural production. These are, increase stewardship of America's natural resources while enhancing the environment, and to ensure commodities are procured and distributed effectively and efficiently to increase food security. The NAIP program supports these goals by acquiring and providing ortho imagery that has been collected during the agricultural growing season in the U.S. The NAIP ortho imagery is tailored to meet FSA requirements and is a fundamental tool used to support FSA farm and conservation programs....
Types: Citation;
Tags: 20147,
3.75 x 3.75 minute,
3909921,
Aerial Compliance,
Compliance, All tags...
Digital Ortho rectified Image,
Downloadable Data,
JPEG2000,
KS,
KS147,
NAIP,
Ortho Rectification,
Orthoimagery,
PHILLIPS CO KS FSA,
Phillips,
Quarter Quadrangle,
SPEED,
SPEED, SE,
USDA National Agriculture Imagery Program (NAIP),
farming, Fewer tags
This data set contains imagery from the National Agriculture Imagery Program (NAIP). The NAIP program is administered by USDA FSA and has been established to support two main FSA strategic goals centered on agricultural production. These are increase stewardship of America's natural resources while enhancing the environment, and to ensure commodities are procured and distributed effectively and efficiently to increase food security. The NAIP program supports these goals by acquiring and providing ortho imagery that has been collected during the agricultural growing season in the U.S. The NAIP ortho imagery is tailored to meet FSA requirements and is a fundamental tool used to support FSA farm and conservation programs....
Types: Citation;
Tags: 18019,
3.75 x 3.75 minute,
3808534,
Aerial Compliance,
CLARK CO IN FSA, All tags...
Clark,
Compliance,
Digital Ortho rectified Image,
Downloadable Data,
IN,
IN019,
JPEG 2000,
JPEG2000,
NAIP,
Ortho Rectification,
Orthoimagery,
Quarter Quadrangle,
SPEED,
SPEED, NE,
USDA National Agriculture Imagery Program (NAIP),
farming,
imageryBaseMapsEarthCover, Fewer tags
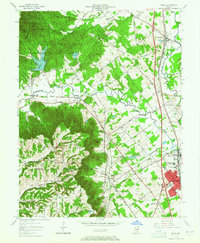
USGS Historical Quadrangle in GeoPDF.
Tags: 7.5 x 7.5 minute,
Downloadable Data,
GeoPDF,
GeoTIFF,
Historical Topographic Maps, All tags...
Historical Topographic Maps 7.5 x 7.5 Minute Map Series,
IN,
Map,
Speed,
imageryBaseMapsEarthCover, Fewer tags
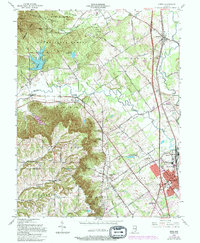
USGS Historical Quadrangle in GeoPDF.
Tags: 7.5 x 7.5 minute,
Downloadable Data,
GeoPDF,
GeoTIFF,
Historical Topographic Maps, All tags...
Historical Topographic Maps 7.5 x 7.5 Minute Map Series,
IN,
Map,
Speed,
imageryBaseMapsEarthCover, Fewer tags

Annual average offshore wind speed for the Atlantic Coast (Connecticut, Delaware, Georgia, Massachusetts, Maine, Maryland, New Hampshire, New Jersey, New York, North Carolina, Rhode Island, South Carolina, and Virginia) at a 90 meter height. Available from the National Renewable Energy Laboratory (NREL) at http://www.nrel.gov/renewable_resources/ . This dataset was last updated on 8/23/2010.
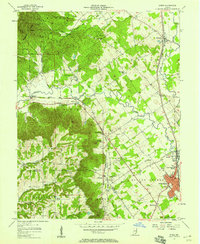
USGS Historical Quadrangle in GeoPDF.
Tags: 7.5 x 7.5 minute,
Downloadable Data,
GeoPDF,
GeoTIFF,
Historical Topographic Maps, All tags...
Historical Topographic Maps 7.5 x 7.5 Minute Map Series,
IN,
Map,
Speed,
imageryBaseMapsEarthCover, Fewer tags
USGS Historical Quadrangle in GeoPDF.
Tags: 7.5 x 7.5 minute,
Downloadable Data,
GeoPDF,
GeoTIFF,
Historical Topographic Maps, All tags...
Historical Topographic Maps 7.5 x 7.5 Minute Map Series,
IN,
Map,
Preliminary,
Speed,
imageryBaseMapsEarthCover, Fewer tags
USGS Historical Quadrangle in GeoPDF.
Tags: 7.5 x 7.5 minute,
Downloadable Data,
GeoPDF,
GeoTIFF,
Historical Topographic Maps, All tags...
Historical Topographic Maps 7.5 x 7.5 Minute Map Series,
IN,
Map,
Speed,
imageryBaseMapsEarthCover, Fewer tags
This data set contains imagery from the National Agriculture Imagery Program (NAIP). The NAIP program is administered by USDA FSA and has been established to support two main FSA strategic goals centered on agricultural production. These are, increase stewardship of America's natural resources while enhancing the environment, and to ensure commodities are procured and distributed effectively and efficiently to increase food security. The NAIP program supports these goals by acquiring and providing ortho imagery that has been collected during the agricultural growing season in the U.S. The NAIP ortho imagery is tailored to meet FSA requirements and is a fundamental tool used to support FSA farm and conservation programs....
Types: Citation;
Tags: 20147,
3.75 x 3.75 minute,
3909921,
Aerial Compliance,
Compliance, All tags...
Digital Ortho rectified Image,
Downloadable Data,
JPEG2000,
KS,
KS147,
NAIP,
Ortho Rectification,
Orthoimagery,
PHILLIPS CO KS FSA,
Phillips,
Quarter Quadrangle,
SPEED,
SPEED, NW,
USDA National Agriculture Imagery Program (NAIP),
farming, Fewer tags
This data set contains imagery from the National Agriculture Imagery Program (NAIP). The NAIP program is administered by USDA FSA and has been established to support two main FSA strategic goals centered on agricultural production. These are increase stewardship of America's natural resources while enhancing the environment, and to ensure commodities are procured and distributed effectively and efficiently to increase food security. The NAIP program supports these goals by acquiring and providing ortho imagery that has been collected during the agricultural growing season in the U.S. The NAIP ortho imagery is tailored to meet FSA requirements and is a fundamental tool used to support FSA farm and conservation programs....
Types: Citation;
Tags: 3.75 x 3.75 minute,
3507705,
37117,
Aerial Compliance,
Compliance, All tags...
Digital Ortho rectified Image,
Downloadable Data,
JPEG 2000,
JPEG2000,
MARTIN CO NC FSA,
Martin,
NAIP,
NC,
NC117,
Ortho Rectification,
Orthoimagery,
Quarter Quadrangle,
SPEED,
SPEED, NE,
USDA National Agriculture Imagery Program (NAIP),
farming,
imageryBaseMapsEarthCover, Fewer tags
|
|

