Filters: Tags: Puget Sound (X)
195 results (13ms)|
Filters
Date Range
Extensions
Types Contacts
Categories
Tag Types
|
This portion of the data release presents topographic point clouds of the intertidal zone at Puget Creek and Dickman Mill Park, Tacoma, WA, derived from structure-from-motion (SfM) processing of aerial imagery collected with an unmanned aerial system (UAS) on 2019-06-03. The point clouds for Puget Creek and Dickman Mill Park contain 74,565,548 and 122,791,637 points, respectively, at an approximate point spacing of 1 point every 2 centimeters. Each point contains an explicit horizontal and vertical coordinate, color, intensity, and classification. Water portions of the point cloud were classified using a polygon digitized from the orthomosaic imagery derived from these surveys (also available in this data release)....
This portion of the data release presents the raw aerial imagery collected during an Unmanned Aerial System (UAS) survey of the intertidal zone at Post Point, Bellingham Bay, WA, on 2019-06-06. The imagery was acquired using a Department of Interior-owned 3DR Solo quadcopter fitted with a Ricoh GR II digital camera featuring a global shutter. The camera was mounted using a fixed mount on the bottom of the UAS and oriented in an approximately nadir orientation. The UAS was flown on pre-programmed autonomous flight lines which were oriented roughly shore-parallel and were spaced to provide approximately 70 percent overlap between images from adjacent lines. Three flights (F01, F02, F03) covering the survey area were...
This portion of the USGS data release presents eelgrass distribution and bathymetry data derived from acoustic surveys of the Nisqually River delta, Washington in 2014 (USGS Field Activity Number D-01-14-PS). Eelgrass and bathymetry data were collected from the R/V George Davidson equipped with a single-beam sonar system and global navigation satellite system (GNSS) receiver. The sonar system consisted of a Biosonics DT-X single-beam echosounder and 420 kHz transducer with a 6-degree beam angle. Depths from the echosounder were computed using sound velocity data measured using a YSI CastAway CTD during the survey. Positioning of the survey vessel was determined at 5 to 10 Hz using a Trimble R7 GNSS receiver and...
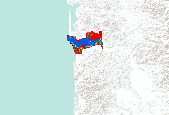
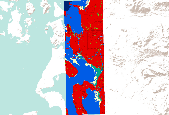
In order to predict the impacts of climate change induced sea-level rise on Pacific Northwest coastal habitats, the Sea Level Affecting Marshes Model (SLAMM) was utilized to simulate future coastal habitat configurations under various sea-level rise scenarios. The model was run for 2025, 2050, 2075, and 2100. Historical or "initial condition" habitat classifications are also available for some sites. The sea-level rise scenarios include: 1. A1B greenhouse gas emission mean : 0.39 meter rise by 2100 2. A1B greenhouse gas emission maximum : 0.69 meter rise by 2100 3. 1 meter rise by 2100 4. 1.5 meter rise by 2100 5. 2 meter rise by 2100 Due to differing site conditions, local sea-level rise varies slightly from...

In order to predict the impacts of climate change induced sea-level rise on Pacific Northwest coastal habitats, the Sea Level Affecting Marshes Model (SLAMM) was utilized to simulate future coastal habitat configurations under various sea-level rise scenarios. The model was run for 2025, 2050, 2075, and 2100. Historical or "initial condition" habitat classifications are also available for some sites. The sea-level rise scenarios include: 1. A1B greenhouse gas emission mean : 0.39 meter rise by 2100 2. A1B greenhouse gas emission maximum : 0.69 meter rise by 2100 3. 1 meter rise by 2100 4. 1.5 meter rise by 2100 5. 2 meter rise by 2100 Due to differing site conditions, local sea-level rise varies slightly from...

In order to predict the impacts of climate change induced sea-level rise on Pacific Northwest coastal habitats, the Sea Level Affecting Marshes Model (SLAMM) was utilized to simulate future coastal habitat configurations under various sea-level rise scenarios. The model was run for 2025, 2050, 2075, and 2100. Historical or "initial condition" habitat classifications are also available for some sites. The sea-level rise scenarios include: 1. A1B greenhouse gas emission mean : 0.39 meter rise by 2100 2. A1B greenhouse gas emission maximum : 0.69 meter rise by 2100 3. 1 meter rise by 2100 4. 1.5 meter rise by 2100 5. 2 meter rise by 2100 Due to differing site conditions, local sea-level rise varies slightly from...
In order to predict the impacts of climate change induced sea-level rise on Pacific Northwest coastal habitats, the Sea Level Affecting Marshes Model (SLAMM) was utilized to simulate future coastal habitat configurations under various sea-level rise scenarios. The model was run for 2025, 2050, 2075, and 2100. Historical or "initial condition" habitat classifications are also available for some sites. The sea-level rise scenarios include: 1. A1B greenhouse gas emission mean : 0.39 meter rise by 2100 2. A1B greenhouse gas emission maximum : 0.69 meter rise by 2100 3. 1 meter rise by 2100 4. 1.5 meter rise by 2100 5. 2 meter rise by 2100 Due to differing site conditions, local sea-level rise varies slightly from...

In order to predict the impacts of climate change induced sea-level rise on Pacific Northwest coastal habitats, the Sea Level Affecting Marshes Model (SLAMM) was utilized to simulate future coastal habitat configurations under various sea-level rise scenarios. The model was run for 2025, 2050, 2075, and 2100. Historical or "initial condition" habitat classifications are also available for some sites. The sea-level rise scenarios include: 1. A1B greenhouse gas emission mean : 0.39 meter rise by 2100 2. A1B greenhouse gas emission maximum : 0.69 meter rise by 2100 3. 1 meter rise by 2100 4. 1.5 meter rise by 2100 5. 2 meter rise by 2100 Due to differing site conditions, local sea-level rise varies slightly from...

In order to predict the impacts of climate change induced sea-level rise on Pacific Northwest coastal habitats, the Sea Level Affecting Marshes Model (SLAMM) was utilized to simulate future coastal habitat configurations under various sea-level rise scenarios. The model was run for 2025, 2050, 2075, and 2100. Historical or "initial condition" habitat classifications are also available for some sites. The sea-level rise scenarios include: 1. A1B greenhouse gas emission mean : 0.39 meter rise by 2100 2. A1B greenhouse gas emission maximum : 0.69 meter rise by 2100 3. 1 meter rise by 2100 4. 1.5 meter rise by 2100 5. 2 meter rise by 2100 Due to differing site conditions, local sea-level rise varies slightly from...

In order to predict the impacts of climate change induced sea-level rise on Pacific Northwest coastal habitats, the Sea Level Affecting Marshes Model (SLAMM) was utilized to simulate future coastal habitat configurations under various sea-level rise scenarios. The model was run for 2025, 2050, 2075, and 2100. Historical or "initial condition" habitat classifications are also available for some sites. The sea-level rise scenarios include: 1. A1B greenhouse gas emission mean : 0.39 meter rise by 2100 2. A1B greenhouse gas emission maximum : 0.69 meter rise by 2100 3. 1 meter rise by 2100 4. 1.5 meter rise by 2100 5. 2 meter rise by 2100 Due to differing site conditions, local sea-level rise varies slightly from...

In order to predict the impacts of climate change induced sea-level rise on Pacific Northwest coastal habitats, the Sea Level Affecting Marshes Model (SLAMM) was utilized to simulate future coastal habitat configurations under various sea-level rise scenarios. The model was run for 2025, 2050, 2075, and 2100. Historical or "initial condition" habitat classifications are also available for some sites. The sea-level rise scenarios include: 1. A1B greenhouse gas emission mean : 0.39 meter rise by 2100 2. A1B greenhouse gas emission maximum : 0.69 meter rise by 2100 3. 1 meter rise by 2100 4. 1.5 meter rise by 2100 5. 2 meter rise by 2100 Due to differing site conditions, local sea-level rise varies slightly from...

In order to predict the impacts of climate change induced sea-level rise on Pacific Northwest coastal habitats, the Sea Level Affecting Marshes Model (SLAMM) was utilized to simulate future coastal habitat configurations under various sea-level rise scenarios. The model was run for 2025, 2050, 2075, and 2100. Historical or "initial condition" habitat classifications are also available for some sites. The sea-level rise scenarios include: 1. A1B greenhouse gas emission mean : 0.39 meter rise by 2100 2. A1B greenhouse gas emission maximum : 0.69 meter rise by 2100 3. 1 meter rise by 2100 4. 1.5 meter rise by 2100 5. 2 meter rise by 2100 Due to differing site conditions, local sea-level rise varies slightly from...

In order to predict the impacts of climate change induced sea-level rise on Pacific Northwest coastal habitats, the Sea Level Affecting Marshes Model (SLAMM) was utilized to simulate future coastal habitat configurations under various sea-level rise scenarios. The model was run for 2025, 2050, 2075, and 2100. Historical or "initial condition" habitat classifications are also available for some sites. The sea-level rise scenarios include: 1. A1B greenhouse gas emission mean : 0.39 meter rise by 2100 2. A1B greenhouse gas emission maximum : 0.69 meter rise by 2100 3. 1 meter rise by 2100 4. 1.5 meter rise by 2100 5. 2 meter rise by 2100 Due to differing site conditions, local sea-level rise varies slightly from...

These data were released prior to the October 1, 2016 effective date for the USGS’s policy dictating the review, approval, and release of scientific data as referenced in USGS Survey Manual Chapter 502.8 Fundamental Science Practices: Review and Approval of Scientific Data for Release. Red alder (Alnus rubra) are a common component of forests in Western Oregon and Washington. This file provides an estimate of red alder basal area in western Oregon and Washington for each incremental catchment of the USGS Pacific Northwest SPARROW model.
Phosphorus is a naturally occurring element found in all rocks; the amount varies by the type of rock. The amount of phosphorus in sediments is expected to be correlated with the amount of phosphorus in the parent rocks. Streambed sediment collected by the National Uranium Resource Evaluation (NURE) Program were used to estimate the variation of phosphorus across the Pacific Northwest. This file provides an estimate of the mean concentration of phosphorus in soils for each incremental catchment of the USGS Pacific Northwest SPARROW model.
|

|
