Filters: Tags: Ottawa, IL (X)
6 results (9ms)|
Filters
|
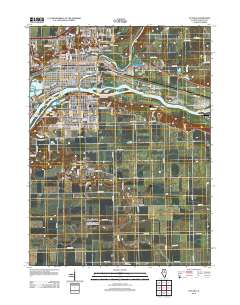
Layered GeoPDF 7.5 Minute Quadrangle Map. Layers of geospatial data include orthoimagery, roads, grids, geographic names, elevation contours, hydrography, and other selected map features.
ADCP data were collected on November 4, 2015 at the confluence of the Illinois River and Fox River near Ottawa, IL using a Teledyne Rio Grande 1200 kHz Acoustic Doppler Current Profiler with integrated Trimble Ag162 GPS. ADCP data was collected in reciprocal pairs along cross-sections. The data are provided in: (1) a zipped folder containing classic ascii output files exported from WinRiverII software, and a README text file indicating which files are reciprocal pairs (2) a zipped folder containing KML files for each transect.
Types: Citation,
Map Service,
OGC WFS Layer,
OGC WMS Layer,
OGC WMS Service;
Tags: Fox River,
Illinois,
Illinois River,
Ottawa, IL,
surface water (non-marine),
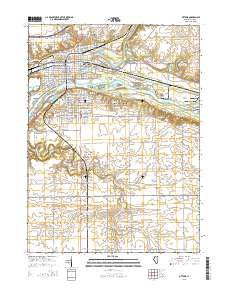
Layered GeoPDF 7.5 Minute Quadrangle Map. Layers of geospatial data include orthoimagery, roads, grids, geographic names, elevation contours, hydrography, and other selected map features.
A hydrodynamic and water-quality model (CE-QUAL-W2) was developed of a 21-mile reach of the upper Illinois River including a 3-mile reach of a major tributary, the Fox River. The CE-QUAL-W2 model is 2-dimensional in the vertical and longitudinal directions and averaged over the lateral direction. Continuous water quality and streamgage data provided time-series data for model boundary conditions. Discrete velocity, cross-section area, and temperature profiles at several locations within the study reach provided model calibration data. The model was calibrated to 2021 and 2022 observed data and validated with 2020 data. Model output consisted of 2-dimensional, laterally averaged hydrodynamic and water-temperature...
Types: Map Service,
OGC WFS Layer,
OGC WMS Layer,
OGC WMS Service;
Tags: Dayton, IL,
Fox River, IL,
Grundy County, IL,
Hydrology,
Illinois River, IL,
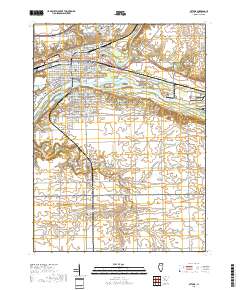
Layered geospatial PDF 7.5 Minute Quadrangle Map. Layers of geospatial data include orthoimagery, roads, grids, geographic names, elevation contours, hydrography, and other selected map features. This map is derived from GIS (geospatial information system) data. It represents a repackaging of GIS data in traditional map form, not creation of new information. The geospatial data in this map are from selected National Map data holdings and other government sources.
Water velocities were measured in the Illinois and Des Plaines Rivers using a Teledyne Rio Grande 1200 kHz acoustic Doppler current profiler (ADCP). ADCP data were collected in reciprocal pairs along cross-sections and along approximately streamwise-oriented lines between cross sections at the following locations: (1) the confluence of the Fox River and the Illinois River near Ottawa, IL on November 4, 2015 (2) immediately downstream of Starved Rock Lock and Dam on the Illinois River near Utica, IL on May 22, 2015 (3) the Dresden Island Pool of the Des Plaines River on July 31 – August 1, 2013 (4) the Marseilles Pool of the Illinois River on May 14-15, 2013 and May 28, 2013 The WinRiverII ASCII output file and...
|

|
