Filters: Tags: Net Primary Productivity (X)
12 results (10ms)|
Filters
Date Range
Extensions (Less) Types (Less) Contacts (Less)
Categories (Less) Tag Types
|
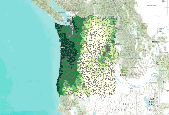
This dataset represents the average net primary production for each HUC5 watershed, simulated by the model MC1 for the 30-year period 1971-2000. Mean net primary production (in g m-2 per yr), was determined for each HUC5 watershed by averaging values of original ~ 4 km raster data. Watersheds represent 5th level (HUC5, 10-digit) hydrologic unit boundaries and were acquired from the Natural Resources Conservation Service. Background: The dynamic global vegetation model MC1 (see Bachelet et al.2001) was used to simulate vegetation dynamics, associated carbon and nitrogen cycle, water budget, and wild fire impacts for OR, WA, AZ and NM, for a project funded by the USDA Forest Service (PNW09-JV-11261900-003). The MC1...
This dataset represents the average net primary production for each HUC5 watershed, simulated by the model MC1 for the 30-year period 1971-2000. Mean net primary production (in g m-2 per yr), was determined for each HUC5 watershed by averaging values of original ~ 4 km raster data. Watersheds represent 5th level (HUC5, 10-digit) hydrologic unit boundaries and were acquired from the Natural Resources Conservation Service. Background: The dynamic global vegetation model MC1 (see Bachelet et al.2001) was used to simulate vegetation dynamics, associated carbon and nitrogen cycle, water budget, and wild fire impacts for OR, WA, AZ and NM, for a project funded by the USDA Forest Service (PNW09-JV-11261900-003). The...
A principal challenge in ecology is to integrate physiological function (e.g. photosynthesis) across a collection of individuals (e.g. plants of different species) to understand the functioning of the entire ensemble (e.g. primary productivity). The control that organism size exerts over physiological and ecological function suggests that allometry could be a powerful tool for scaling ecological processes across levels of organization. Here we use individual plant allometries to predict how nutrient content and productivity scale with total plant biomass (phytomass) in whole plant communities. As predicted by our model, net primary productivity as well as whole community nitrogen and phosphorus content all scale...
Categories: Publication;
Types: Citation,
Journal Citation;
Tags: Community size distribution,
Ecology Letters,
biomass,
ecological stoichiometry,
functional diversity,
Field measurements, daily meteorological inputs, and previously validated iSnobal simulations were used to run and inform the biogeochemical models Biome-BGC and Biome-BGC MuSo at three aspen stands in the Reynolds Creek Experimental Watershed. iSnobal simulations of snow redistribution were used to modify measured precipitation values to account for the redistribution of snow. Biome-BGC simulations were run under historical conditions (1984-2015) assuming both a uniform and redistributed snow layer. Biome-BGC MuSo simulations were run under historical (1996-2015) and future climate scenarios (2046-2065) and account for the redistribution of snow. Biogeochemical simulation data sets include input files used to run...
This data release contains model inputs used to estimate surface water greenhouse gas fluxes from two large arid reservoirs, Lake Powell and Lake Mead. The release also contains empirical, spatially explicit water quality and greenhouse gas data from a single field survey conducted in Lake Powell in July of 2017. Finally, this release contains surface area estimates of shallow (< 15m) tributary regions of Lake Powell under different water level scenarios.

Gridded information on NPP is derived from NASAâs MODIS satellite data in a 10 km2 grid cell resolution based on monthly values averaged for 2010 in gC m-2 day-1. Data were transformed to a standardized scale based on their maximum values. Hence, all values range between 0 and 1.
We investigated the relationship between plant nitrogen limitation and water availability in dryland ecosystems. We tested the hypothesis that at lower levels of annual precipitation, aboveground net primary productivity (ANPP) is limited primarily by water whereas at higher levels of precipitation, it is limited primarily by nitrogen. Using a literature survey of fertilization experiments in arid, semi-arid, and subhumid ecosystems, we investigated the response of ANPP to nitrogen addition as a function of variation in precipitation across geographic gradients, as well as across year-to-year variation in precipitation within sites. We used four different indices to assess the degree of N limitation: (1) Absolute...
Categories: Publication;
Types: Citation,
Journal Citation;
Tags: Arid,
Biogeochemistry,
Fertilization,
Kluwer Academic Publishers,
Net primary productivity,
The Chihuahuan desert of New Mexico, USA, has changed in historical times from semiarid grassland to desert shrublands dominated by Larrea tridentata and Prosopis glandulosa. Similar displacement of perennial grasslands by shrubs typifies desertification in many regions. Such structural vegetation change could alter average values of net primary productivity, as well as spatial and temporal patterns of production. We investigated patterns of aboveground plant biomass and net primary production in five ecosystem types of the Jornada Basin Long-Term Ecological Research (LTER) site. Comparisons of shrub-dominated desertified systems and remnant grass-dominated systems allowed us to test the prediction that shrublands...
Categories: Publication;
Types: Citation,
Journal Citation;
Tags: Chihuahuan desert,
Global Change Biology,
Jornada LTER,
Larrea tridentata,
Prosopis glandulosa,
This product consists of 29 datasets of tabular data and associated metadata for watershed characteristics of 1,530 study sites of the Surface Water Trends (SWT) project of the U.S. Geological Survey’s (USGS) National Water Quality Program (NWQP). The project is conducting national studies of trends in water quality of streams and rivers for periods ranging from 10 to 40 years, between 1972 and 2012. The data here include both static and time-series characteristics. Static data include primarily physical characteristics which have changed little over this period, such as geology, soils, and topography. Time-series data represent characteristics which may or may not have changed over time, such as land use, agricultural...
Categories: Data;
Types: Citation;
Tags: Atmospheric Deposition,
Basin Morphology,
Census of Agriculture,
Conterminous US,
Crop Practices,
This map package contains a raster layer showing change in Net Primary Productivity (NPP) from 1981 - 2003, derived from remotely sensed Normalized Difference Vegetation Index (NDVI). The layer is one of the FAO's core data sets provided as public domain through the organization's GeoNetwork data portal. The data set has a global extent, so the map package includes U.S. state boundaries and the boundary of the Southern Rockies LCC, to help highlight the changes in this local region. Link to Metadata from the FAO's GeoNetwork. This site has several options for viewing and downloading the data, including KML format for Google Earth. Other layers in this map package: Shapefiles showing SRLCC boundary ( link to metadata...
Categories: Data;
Tags: net primary productivity
Data resources for summarizing annual Net Primary Productivity (NPP) data over the past 2-3 Decades 1. The website of University of Montana’s Numerical Terradynamic Simulation Group provides annual NPP data for the years 2000 - 2012: http://www.ntsg.umt.edu/project/mod17 There are also summaries for change in NPP over the last decade: ftp://ftp.ntsg.umt.edu/pub/MODIS/NTSG_Products/MOD17/Trend_2km_GEOTIFF/ 2. The Global Land Cover Facility’s Global Production Efficiency Model ( GLOPEM): these are annual NPP data sets that cover the years 1981 - 2000. As an example of what can be done with these data sets, here is a 2010 study that calculated NPP changes in high altitude regions of the western U.S.: http://mri.scnatweb.ch/download-document?gid=1115...
Categories: Web Site;
Tags: net primary productivity

Human appropriation of net primary productivity, by terrestrial ecoregion. We derived the map showing the amount of carbon fixed by photosynthesis and then consumed by humans from Imhoff et al. (2004a). A zonal sum procedure was applied to the gridded version of those data to summarize by ecoregion. These data were derived by The Nature Conservancy, and were displayed in a map published in The Atlas of Global Conservation (Hoekstra et al., University of California Press, 2010). More information at http://nature.org/atlas. Data derived from: Imhoff, M. L., L. Bounoua, T. Ricketts, C. Loucks, R. Harriss, and W. T. Lawrence. 2004a. Human Appropriation of Net Primary Productivity (HANPP). Data distributed by the...
|

|
