Filters: Tags: Napa County (X)
213 results (80ms)|
Filters
Date Range
Extensions Types Contacts
Categories Tag Types
|
These datasets supports the conclusions in the journal article entitled "Variations in community evacuation potential related to average return periods in probabilistic tsunami hazard analysis" as described in the abstract below: Tsunami risk management requires strategies that can address multiple sources with different recurrence intervals, wave-arrival times, and inundation extents. Probabilistic tsunami hazard analysis (PTHA) provides a structured way to integrate multiple sources, including the uncertainties due to the natural variability and limited knowledge of sources. PTHA-based products relate to specific average return periods (ARP) and while there has been considerable attention paid to ARP choice for...
This dataset consists of 42 magnetotelluric (MT) stations collected in 2017 in the Northwest Geysers, CA. The U.S. Geological Survey acquired these data as part of a project to image the heat source in the Northwest Geysers. Support was from the U.S. Geological Survey's Volcano Hazards Program.
This dataset consists of 42 magnetotelluric (MT) stations collected in 2017 in the Northwest Geysers, CA. The U.S. Geological Survey acquired these data as part of a project to image the heat source in the Northwest Geysers. Support was from the U.S. Geological Survey's Volcano Hazards Program.
This dataset consists of 42 magnetotelluric (MT) stations collected in 2017 in the Northwest Geysers, CA. The U.S. Geological Survey acquired these data as part of a project to image the heat source in the Northwest Geysers. Support was from the U.S. Geological Survey's Volcano Hazards Program.
This dataset consists of 42 magnetotelluric (MT) stations collected in 2017 in the Northwest Geysers, CA. The U.S. Geological Survey acquired these data as part of a project to image the heat source in the Northwest Geysers. Support was from the U.S. Geological Survey's Volcano Hazards Program.
In May 2015, we acquired high-resolution seismic profiles near six strong motion instruments located in Napa and Solano Counties, California. These strong motion instruments recorded horizontal peak accelerations (PGAs) from 0.329g to 0.611g, which were among the highest recorded in the Napa area during the 24 August 2014 Mw 6.0 South Napa Earthquake. Our goal is to measure the seismic velocities of the underlying geologic material at each strong motion site using P- and S-wave refraction tomography and analysis of surface waves, especially in the upper 30 m of the subsurface.
This product is a collection of digital data that document fault rupture and ground deformation produced by the August 24, 2014 South Napa Earthquake. These datasets are described and more fully discussed in Ponti, D.J, Rosa, C.M, and Blair, J.L., 2019, The Mw 6.0 South Napa Earthquake of August 24, 2014—Observations of surface faulting and ground deformation, with recommendations for improving post-earthquake field investigations: U.S. Geological Survey Open-File Report 2019–1018, https://doi.org/10.3133/ofr20191018. Included in this collection are: 1) Hillshade images that depict fault rupture, in GeoTIFF format derived from hi-resolution airborne lidar data flown on Sept. 9, 2014; 2) GIS Shapefile and KMZ...
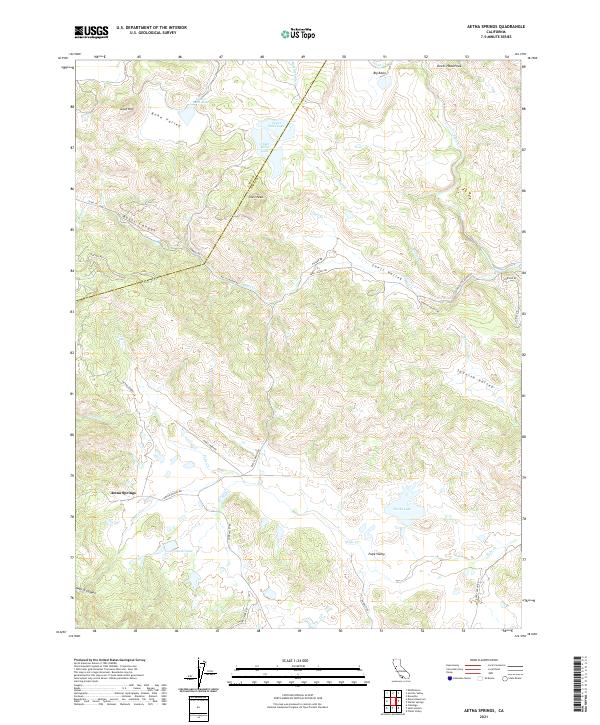
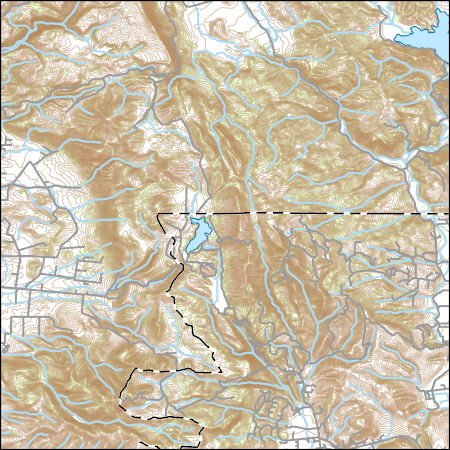
Layered geospatial PDF 7.5 Minute Quadrangle Map. Layers of geospatial data include orthoimagery, roads, grids, geographic names, elevation contours, hydrography, and other selected map features. This map is derived from GIS (geospatial information system) data. It represents a repackaging of GIS data in traditional map form, not creation of new information. The geospatial data in this map are from selected National Map data holdings and other government sources.
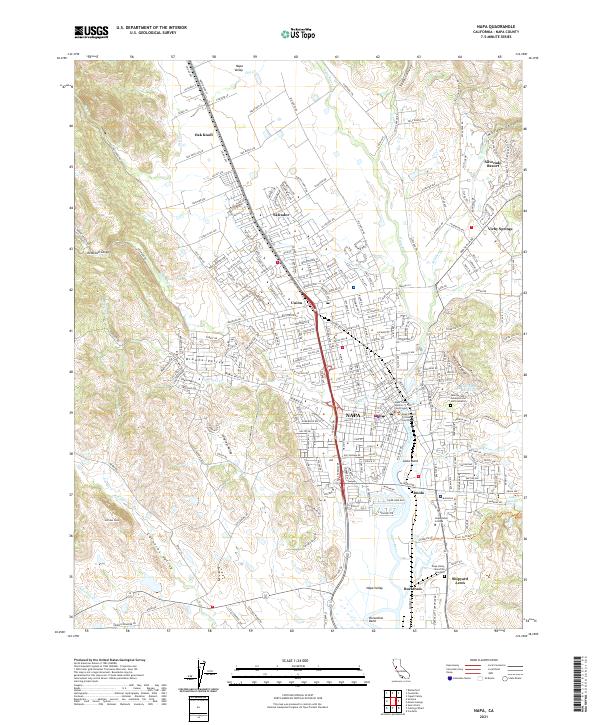
Layered geospatial PDF 7.5 Minute Quadrangle Map. Layers of geospatial data include orthoimagery, roads, grids, geographic names, elevation contours, hydrography, and other selected map features. This map is derived from GIS (geospatial information system) data. It represents a repackaging of GIS data in traditional map form, not creation of new information. The geospatial data in this map are from selected National Map data holdings and other government sources.
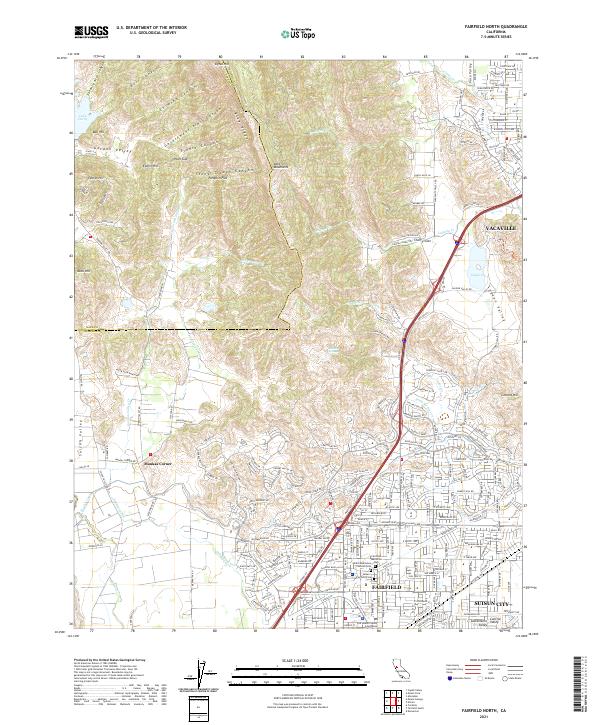
Layered geospatial PDF 7.5 Minute Quadrangle Map. Layers of geospatial data include orthoimagery, roads, grids, geographic names, elevation contours, hydrography, and other selected map features. This map is derived from GIS (geospatial information system) data. It represents a repackaging of GIS data in traditional map form, not creation of new information. The geospatial data in this map are from selected National Map data holdings and other government sources.
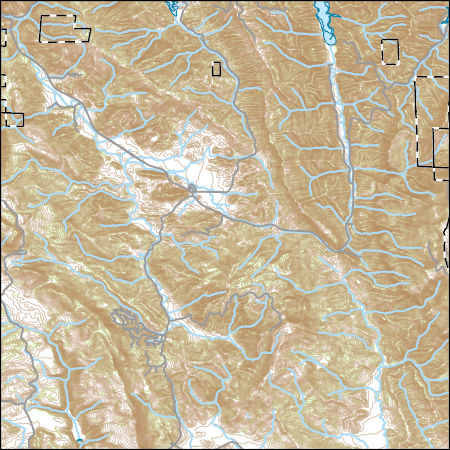
Layers of geospatial data include contours, boundaries, land cover, hydrography, roads, transportation, geographic names, structures, and other selected map features.
Layers of geospatial data include contours, boundaries, land cover, hydrography, roads, transportation, geographic names, structures, and other selected map features.
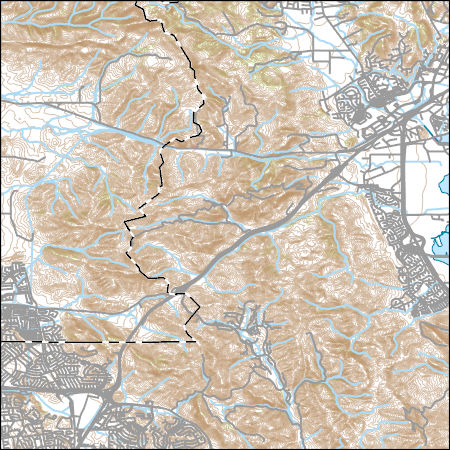
Layers of geospatial data include contours, boundaries, land cover, hydrography, roads, transportation, geographic names, structures, and other selected map features.
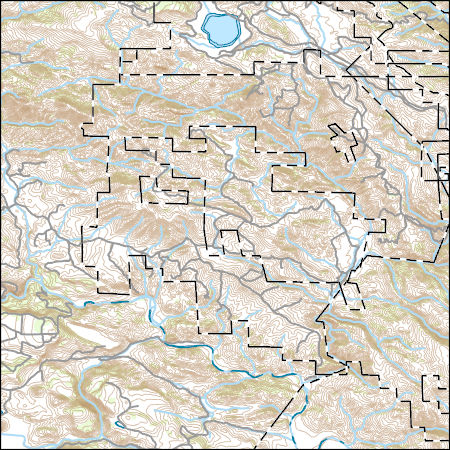
Layers of geospatial data include contours, boundaries, land cover, hydrography, roads, transportation, geographic names, structures, and other selected map features.
These data encompass data classified from the borehole textures. The U.S Geological Survey (USGS) classified the Well Log Database of the Central Valley, California, 2021, into Central_Valley_Borehole_with_Lithology_Classification.csv. Lithologic log descriptions served as the basis for division into discrete binary texture classifications of either “coarse grained” or “fine grained” intervals. Values of 1 (coarse grained), 0 (fine grained) or 2 (unknown) were determined using the table found in Central_Valley_Lithology_Classifier.csv. Percent Coarse values for each well log were calculated at 15.24 m for the entire Central valley (Percent_Coarse_meters_wells.csv).
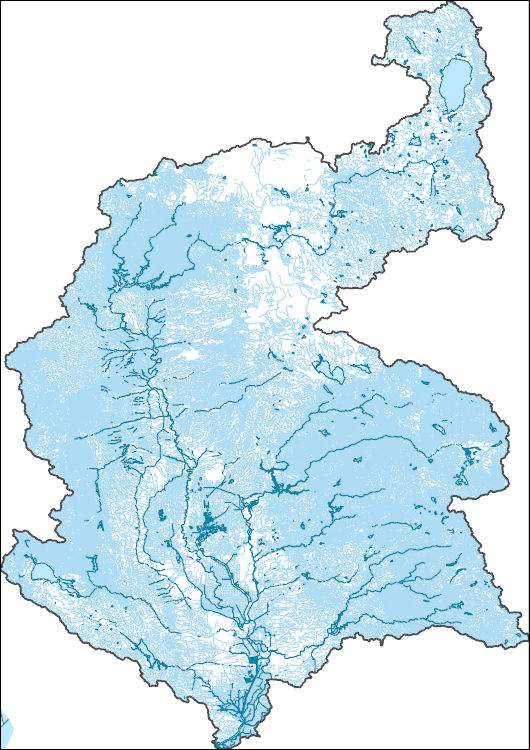
The High Resolution National Hydrography Dataset Plus (NHDPlus HR) is an integrated set of geospatial data layers, including the best available National Hydrography Dataset (NHD), the 10-meter 3D Elevation Program Digital Elevation Model (3DEP DEM), and the National Watershed Boundary Dataset (WBD). The NHDPlus HR combines the NHD, 3DEP DEMs, and WBD to create a stream network with linear referencing, feature naming, "value added attributes" (VAAs), elevation-derived catchments, and other features for hydrologic data analysis. The stream network with linear referencing is a system of data relationships applied to hydrographic systems so that one stream reach "flows" into another and "events" can be tied to and traced...

These data were released prior to the October 1, 2016 effective date for the USGS’s policy dictating the review, approval, and release of scientific data as referenced in USGS Survey Manual Chapter 502.8 Fundamental Science Practices: Review and Approval of Scientific Data for Release. This digital dataset defines the SUB package arrays for the model grid, critical head, thickness of fine-grained deposits, and skeletal-elastic-storage used in the transient hydrologic model of the Central Valley flow system. The Central Valley encompasses an approximate 50,000 square-kilometer region of California. The complex hydrologic system of the Central Valley is simulated using the USGS numerical modeling code MODFLOW-FMP...
Categories: pre-SM502.8;
Tags: Alameda County,
Amador County,
Butte County,
CV-RASA,
Calaveras County,
This dataset consists of 42 magnetotelluric (MT) stations collected in 2017 in the Northwest Geysers, CA. The U.S. Geological Survey acquired these data as part of a project to image the heat source in the Northwest Geysers. Support was from the U.S. Geological Survey's Volcano Hazards Program.
This dataset consists of 42 magnetotelluric (MT) stations collected in 2017 in the Northwest Geysers, CA. The U.S. Geological Survey acquired these data as part of a project to image the heat source in the Northwest Geysers. Support was from the U.S. Geological Survey's Volcano Hazards Program.
This dataset consists of 42 magnetotelluric (MT) stations collected in 2017 in the Northwest Geysers, CA. The U.S. Geological Survey acquired these data as part of a project to image the heat source in the Northwest Geysers. Support was from the U.S. Geological Survey's Volcano Hazards Program.
|

|
