Filters: Tags: Fort Worth (X)
17 results (10ms)|
Filters
Date Range
Extensions Types Contacts
Categories Tag Types Tag Schemes |
Cell maps for each oil and gas assessment unit were created by the USGS as a method for illustrating the degree of exploration, type of production, and distribution of production in an assessment unit or province. Each cell represents a quarter-mile square of the land surface, and the cells are coded to represent whether the wells included within the cell are predominantly oil-producing, gas-producing, both oil and gas-producing, dry, or the type of production of the wells located within the cell is unknown. The well information was initially retrieved from the IHS Energy Group, PI/Dwights PLUS Well Data on CD-ROM, which is a proprietary, commercial database containing information for most oil and gas wells in the...
Categories: Data,
pre-SM502.8;
Types: Downloadable,
Map Service,
OGC WFS Layer,
OGC WMS Layer,
Shapefile;
Tags: 504501 = Barnett Paleozoic,
50450101 = Paleozoic Shelf and Bank Carbonate Oil and Gas,
50450102 = Mississippian Chappel Pinnacle Reef Oil and Gas,
50450161 = Greater Newark East Frac-Barrier Continuous Barnett Shale Gas,
50450162 = Extended Continuous Barnett Shale Gas,
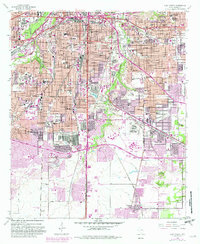
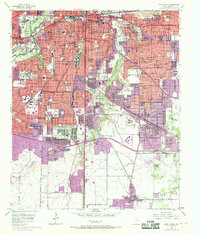
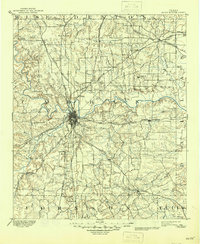
USGS Historical Quadrangle in GeoPDF.
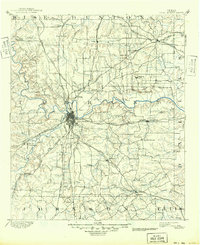
USGS Historical Quadrangle in GeoPDF.
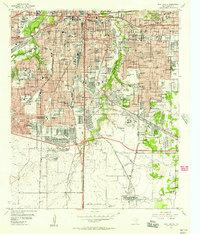
USGS Historical Quadrangle in GeoPDF.
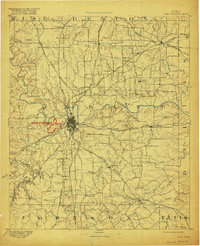
USGS Historical Quadrangle in GeoPDF.
This data set contains imagery from the National Agriculture Imagery Program (NAIP). The NAIP program is administered by USDA FSA and has been established to support two main FSA strategic goals centered on agricultural production. These are increase stewardship of America's natural resources while enhancing the environment, and to ensure commodities are procured and distributed effectively and efficiently to increase food security. The NAIP program supports these goals by acquiring and providing ortho imagery that has been collected during the agricultural growing season in the U.S. The NAIP ortho imagery is tailored to meet FSA requirements and is a fundamental tool used to support FSA farm and conservation programs....
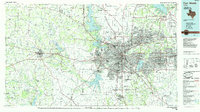
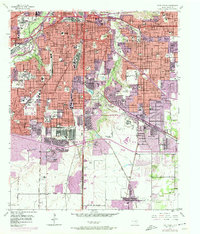
USGS Historical Quadrangle in GeoPDF.
USGS Historical Quadrangle in GeoPDF.
USGS Historical Quadrangle in GeoPDF.
USGS Historical Quadrangle in GeoPDF.
This data set contains imagery from the National Agriculture Imagery Program (NAIP). The NAIP program is administered by USDA FSA and has been established to support two main FSA strategic goals centered on agricultural production. These are increase stewardship of America's natural resources while enhancing the environment, and to ensure commodities are procured and distributed effectively and efficiently to increase food security. The NAIP program supports these goals by acquiring and providing ortho imagery that has been collected during the agricultural growing season in the U.S. The NAIP ortho imagery is tailored to meet FSA requirements and is a fundamental tool used to support FSA farm and conservation programs....
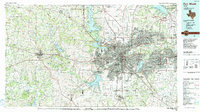
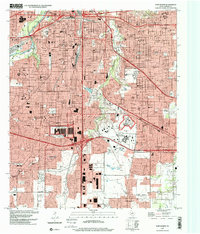
USGS Historical Quadrangle in GeoPDF.
This data set contains imagery from the National Agriculture Imagery Program (NAIP). The NAIP program is administered by USDA FSA and has been established to support two main FSA strategic goals centered on agricultural production. These are increase stewardship of America's natural resources while enhancing the environment, and to ensure commodities are procured and distributed effectively and efficiently to increase food security. The NAIP program supports these goals by acquiring and providing ortho imagery that has been collected during the agricultural growing season in the U.S. The NAIP ortho imagery is tailored to meet FSA requirements and is a fundamental tool used to support FSA farm and conservation programs....
USGS Historical Quadrangle in GeoPDF.
Dispersal, establishment, and spread of aquatic invasive species such as the zebra mussel (Dreissena polymorpha) can be influenced by riverine velocities and volumetric flows in invaded lake-stream ecosystems. Zebra mussels, which have a planktonic larval form (veliger), disperse rapidly downstream from a source population. Concentrations, dispersal, and body conditions of zebra mussel veligers were studied under different volumetric flow, or discharge, conditions in a coupled lake-stream ecosystem in northern Texas, USA. Veliger densities in lotic environments were strongly related to population dynamics in upstream lentic source populations. A strong exponential decrease in veliger density was observed through...
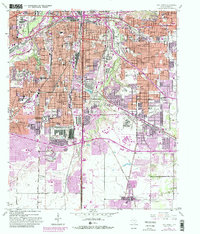
USGS Historical Quadrangle in GeoPDF.
This data set contains imagery from the National Agriculture Imagery Program (NAIP). The NAIP program is administered by USDA FSA and has been established to support two main FSA strategic goals centered on agricultural production. These are increase stewardship of America's natural resources while enhancing the environment, and to ensure commodities are procured and distributed effectively and efficiently to increase food security. The NAIP program supports these goals by acquiring and providing ortho imagery that has been collected during the agricultural growing season in the U.S. The NAIP ortho imagery is tailored to meet FSA requirements and is a fundamental tool used to support FSA farm and conservation programs....
|

|
