Filters: Tags: COLUMBIA RIVER (X)
78 results (11ms)|
Filters
Contacts
(Less)
|

These data were released prior to the October 1, 2016 effective date for the USGS’s policy dictating the review, approval, and release of scientific data as referenced in USGS Survey Manual Chapter 502.8 Fundamental Science Practices: Review and Approval of Scientific Data for Release. Estuarine ecosystems are controlled by a variety of processes that operate at multiple spatial and temporal scales. Understanding the hierarchical nature of these processes will aid in prioritization of restoration efforts. This hierarchical Columbia River Estuary Ecosystem Classification (henceforth "Classification") of the Columbia River estuary is a spatial database of the tidally-influenced reaches of the lower Columbia River,...

These data were released prior to the October 1, 2016 effective date for the USGS’s policy dictating the review, approval, and release of scientific data as referenced in USGS Survey Manual Chapter 502.8 Fundamental Science Practices: Review and Approval of Scientific Data for Release. Estuarine ecosystems are controlled by a variety of processes that operate at multiple spatial and temporal scales. Understanding the hierarchical nature of these processes will aid in prioritization of restoration efforts. This hierarchical Columbia River Estuary Ecosystem Classification (henceforth "Classification") of the Columbia River estuary is a spatial database of the tidally-influenced reaches of the lower Columbia River,...
This portion of the USGS data release presents bathymetry data collected during surveys performed in the Columbia River littoral cell, Washington and Oregon in 2014 (USGS Field Activity Number 2014-631-FA). Bathymetry data were collected using four personal watercraft (PWCs) equipped with single-beam sonar systems and global navigation satellite system (GNSS) receivers. The sonar systems consisted of an Odom Echotrac CV-100 single-beam echosounder and 200 kHz transducer with a 9 degree beam angle. Raw acoustic backscatter returns were digitized by the echosounder with a vertical resolution of 1.25 cm. Depths from the echosounders were computed using sound velocity profiles measured using a YSI CastAway CTD during...
Categories: Data;
Types: Map Service,
OGC WFS Layer,
OGC WMS Layer,
OGC WMS Service;
Tags: Bathymetry and Elevation,
CMHRP,
Clatsop County,
Coastal and Marine Hazards and Resources Program,
Columbia River,
This portion of the data release presents the locations of the temporary ground control points (GCPs) used for the structure-from-motion (SfM) processing of the imagery collected during the July 2021 unoccupied aerial system (UAS) surveys of the ocean beach at Fort Stevens State Park, OR, and Benson Beach at Cape Disappointment State Park, WA. Eighteen temporary ground control points (GCPs) were distributed throughout the survey area to establish survey control. The GCPs consisted of a combination of small square tarps with black-and-white cross patterns and "X" marks placed on the ground using temporary chalk. The GCP positions were measured using dual-frequency post-processed kinematic (PPK) GPS with corrections...
Categories: Data;
Tags: Bathymetry and Elevation,
Benson Beach,
CHMRP,
Cape Disappointment,
Clatsop County,
This data release contains motorboat-towed floating transient electromagnetic data collected from the Columbia River near Hanford WA. Data were collected using a ~16 foot (4.9 meters) outboard motorboat during two field campaigns: July 2021 and April 2022. In total, several hundred linear kilometers of data were collected from a reach of the Columbia that extends from approximately Vernita Bridge to Richland, WA with some additional data collected in the Horn area north of White Bluffs in April 2022. An Aarhus Geoinstruments FloaTEM system was used to collect these data. The depth of investigation of the FloaTEM system is variable but ranged from approximately 50 to 100 meters. Previously collected high-resolution...
Categories: Data;
Tags: Aquifer Mapping,
Columbia River,
Geophysics,
Hanford Reach,
Hydrogeologic Characterization,
Sandy ocean beaches are a popular recreational destination, often surrounded by communities containing valuable real estate. Development is on the rise despite the fact that coastal infrastructure is subjected to flooding and erosion. As a result, there is an increased demand for accurate information regarding past and present shoreline changes. To meet these national needs, the Coastal and Marine Geology Program of the U.S. Geological Survey (USGS) is compiling existing reliable historical shoreline data along open-ocean sandy shores of the conterminous United States and parts of Alaska and Hawaii under the National Assessment of Shoreline Change project.There is no widely accepted standard for analyzing shoreline...
Categories: Data;
Types: ArcGIS REST Map Service,
ArcGIS Service Definition,
Downloadable,
Map Service;
Tags: Accretion,
CMGP,
Coastal and Marine Geology Program,
Columbia River,
DSAS,
Project Summary Climate change is projected to have substantial impacts on Pacific Northwest water resources and ecosystems. Recognizing this, resource managers have expressed growing interest in incorporating climate change information into long-range planning. The availability of hydrologic scenarios to support climate change adaptation and long-range planning, however, has been limited until very recently to a relatively small number of selected case studies. More comprehensive resources needed to support regional planning have been lacking. Furthermore, ecosystem studies at the landscape scale need consistent climate change information and databases over large geographic areas. Products using a common set of...

These data were released prior to the October 1, 2016 effective date for the USGS’s policy dictating the review, approval, and release of scientific data as referenced in USGS Survey Manual Chapter 502.8 Fundamental Science Practices: Review and Approval of Scientific Data for Release. Estuarine ecosystems are controlled by a variety of processes that operate at multiple spatial and temporal scales. Understanding the hierarchical nature of these processes will aid in prioritization of restoration efforts. This hierarchical Columbia River Estuary Ecosystem Classification (henceforth "Classification") of the Columbia River estuary is a spatial database of the tidally-influenced reaches of the lower Columbia River,...
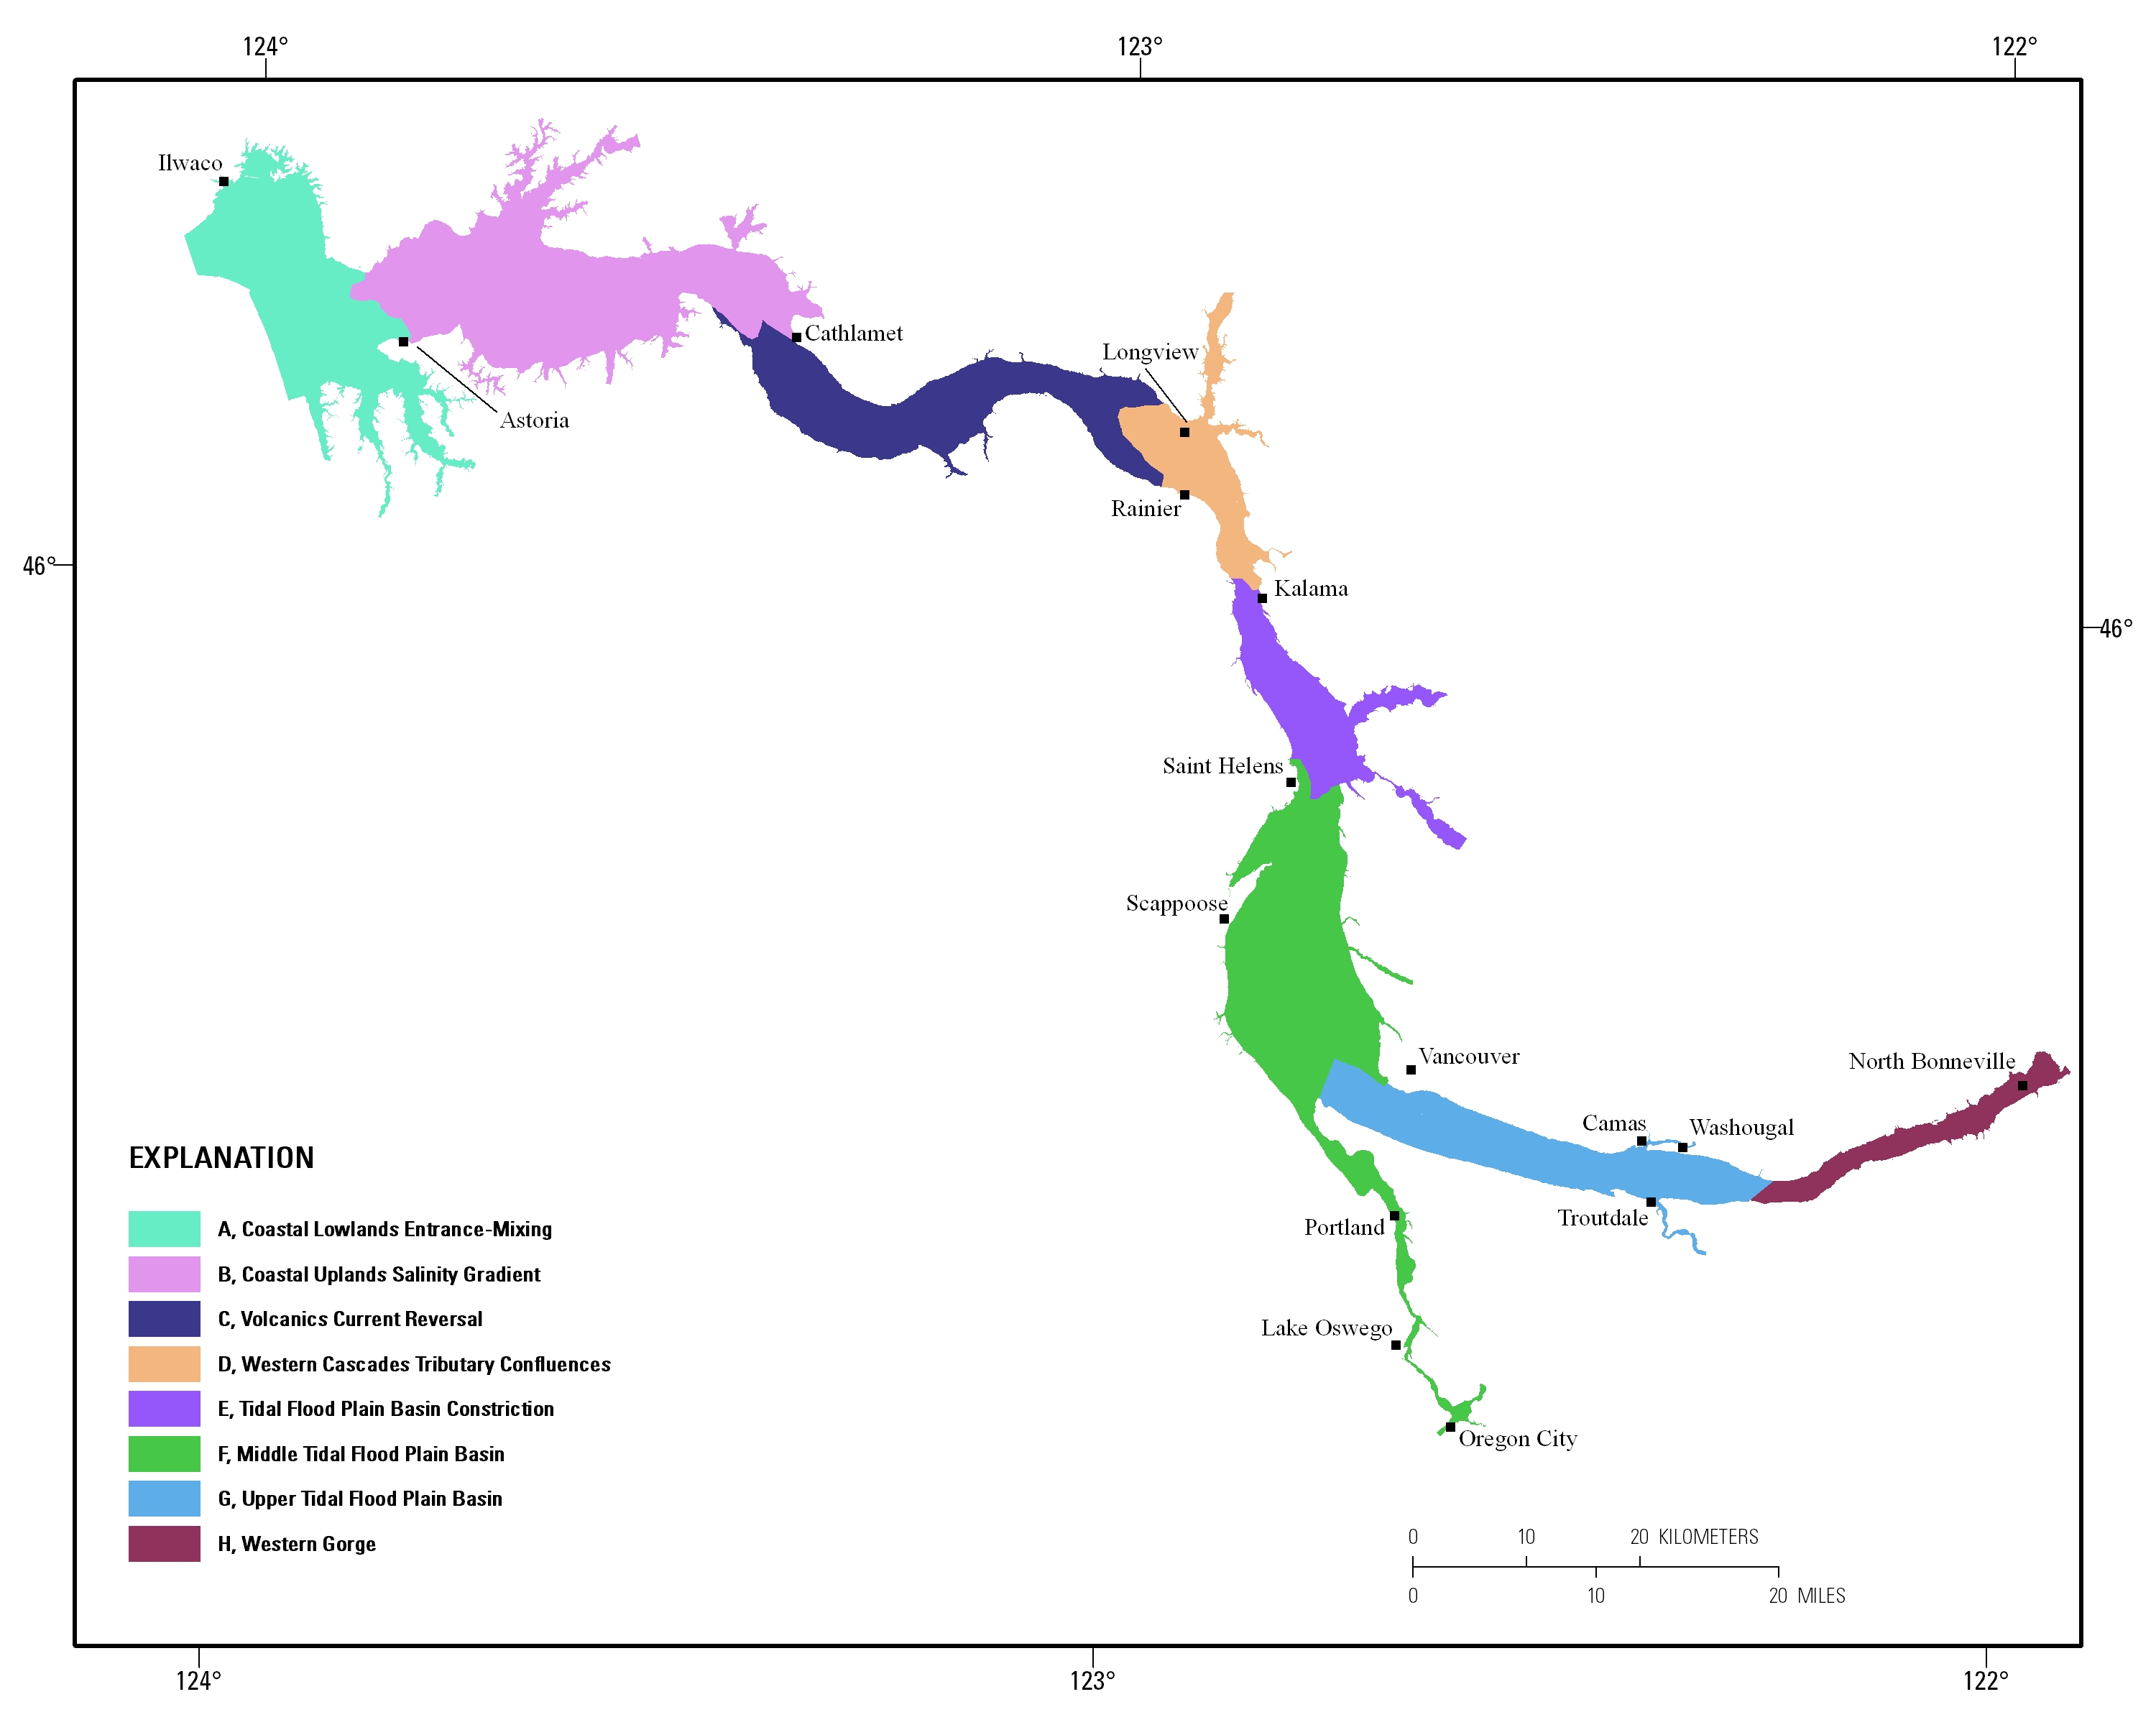
Estuarine ecosystems are controlled by a variety of processes that operate at multiple spatial and temporal scales. Understanding the hierarchical nature of these processes will aid in prioritization of restoration efforts. This hierarchical Columbia River Estuary Ecosystem Classification (henceforth "Classification") of the Columbia River estuary is a spatial database of the tidally-influenced reaches of the lower Columbia River, the tidally affected parts of its tributaries, and the landforms that make up their floodplains for the 230 kilometers between the Pacific Ocean and Bonneville Dam. This work is a collaborative effort between University of Washington School of Aquatic and Fishery Sciences (henceforth "UW"),...
This portion of the USGS data release presents topography data collected during surveys performed in the Columbia River littoral cell, Washington and Oregon, in 2020 (USGS Field Activity Number 2020-622-FA). Topographic profiles were collected by walking along survey lines with global navigation satellite system (GNSS) receivers mounted on backpacks. Prior to data collection, vertical distances between the GNSS antennas and the ground were measured using a tape measure. Hand-held data collectors were used to log raw data and display navigational information allowing surveyors to navigate survey lines spaced at 100- to 1000-m intervals along the beach. Profiles were surveyed from the landward edge of the study area...
Categories: Data;
Types: Map Service,
OGC WFS Layer,
OGC WMS Layer,
OGC WMS Service;
Tags: Bathymetry and Elevation,
CMHRP,
Clatsop County,
Coastal and Marine Hazards and Resources Program,
Columbia River,
This portion of the USGS data release presents topography data collected during surveys performed in the Columbia River littoral cell, Washington and Oregon, in 2017 (USGS Field Activity Number 2017-666-FA). Topographic profiles were collected by walking along survey lines with global navigation satellite system (GNSS) receivers mounted on backpacks. Prior to data collection, vertical distances between the GNSS antennas and the ground were measured using a tape measure. Hand-held data collectors were used to log raw data and display navigational information allowing surveyors to navigate survey lines spaced at 100- to 1000-m intervals along the beach. Profiles were surveyed from the landward edge of the study area...
Categories: Data;
Types: Map Service,
OGC WFS Layer,
OGC WMS Layer,
OGC WMS Service;
Tags: Bathymetry and Elevation,
CMHRP,
Clatsop County,
Coastal and Marine Hazards and Resources Program,
Columbia River,
A three-dimensional hydrodynamic and sediment transport model application of the mouth of the Columbia River (MCR) was constructed using the Delft3D4 (D3D) modeling suite (Deltares, 2021) to simulate water levels, flow, waves, and sediment transport for time period of September 22, 2020 to March 10, 2021. The model was used to predict the dispersal of sediment from a submerged, nearshore berm composed of sediment that was dredged from the entrance to the MCR navigation channel and placed on the northern flank of the ebb-tidal delta. This data release describes the development and validation of the model application and provides input files suitable to run the models on D3D software version 4.04.01.
Categories: Data;
Tags: CMHRP,
Clatsop County,
Coastal and Marine Hazards and Resources Program,
Columbia River,
PCMSC,
This portion of the data release presents the raw aerial imagery collected during the uncrewed aerial system (UAS) survey conducted on the ocean beaches adjacent to the Columbia River Mouth at the Oregon-Washington border in August 2017. The imagery was acquired using a Department of Interior-owned 3DR Solo quadcopter fitted with a Ricoh GR II digital camera featuring a global shutter. The camera was mounted using a fixed mount on the bottom of the UAS and oriented in an approximately nadir orientation. The Fort Stevens State Park survey was conducted under Oregon Parks and Recreation Department Scientific Research Permit #024-17. Five flights were conducted at Fort Stevens State Park on 7 August 2017, between 16:32...
Categories: Data;
Tags: Bathymetry and Elevation,
Benson Beach,
CHMRP,
Cape Disappointment,
Clatsop County,
Aquatic invasive species are often transported between water bodies on boats or boat trailers, thus they are considered one of the primary vectors for new introductions of invasive species to a water body. This data set contains geographic positioning system locational data for boater access points, use data (i.e. recreational, fishing), water quality measurements (e.g. calcium concentrations, pH), risk assessment data, and other physical attributes (i.e. size, elevation) where available within the Columbia and Snake Rivers and throughout the Columbia River Basin. This work builds on an earlier body of work by Wells et al. 2011, Prioritizing Zebra and Quagga Mussel Monitoring in the Columbia River Basin (PDF link...
Categories: Data;
Tags: Boat ramps,
Columbia River,
Columbia River Basin,
Dreissenids,
access points,
This GIS dataset is the primary data product produced for the NW Climate Science Center-funded project, "Rangewide climate vulnerability assessment for threatened Bull Trout" (FRESC Study ID 851). We used predictions of temperatures in streams across approximately two-thirds of the species' range in the U.S. to map coldwater streams or “patches” suitable for spawning and early rearing of Bull Trout. Each patch consists of streams with contiguous reaches of cold water. Patches were delineated using medium resolution National Hydrography Dataset streams containing modeled temperatures available at 1 km intervals, as provided by the NorWeST project (http://www.fs.fed.us/rm/boise/AWAE/projects/NorWeST.html).Once the...
Categories: Data;
Types: Downloadable,
Map Service,
OGC WFS Layer,
OGC WMS Layer,
Shapefile;
Tags: Bull trout,
Clark Fork River,
Clearwater River,
Climate change,
Columbia River,
This portion of the data release provides the data used to develop the calibration equation for the images in Digital seafloor images and sediment grain size from the mouth of the Columbia River, Oregon and Washington, 2014 for the estimate of median grain size. This dataset includes 63 still images extracted from digital video imagery of sediment grab samples along with laboratory grain size analysis of the sediment grab samples taken from the mouth of the Columbia River, OR and WA, USA. Still images were extracted from video footage whenever the camera was resting on the sediment sample and individual sediment grains were visible and in focus. The images were used to calculate the calibration curve through auto-correlation...
Categories: Data;
Types: Citation;
Tags: Columbia River,
State of Oregon,
State of Washington,
Substrate,
estuarine processes,
This portion of the USGS data release presents topography data collected during surveys performed in the Columbia River littoral cell, Washington and Oregon, in 2018 (USGS Field Activity Number 2018-652-FA). Topographic profiles were collected by walking along survey lines with global navigation satellite system (GNSS) receivers mounted on backpacks. Prior to data collection, vertical distances between the GNSS antennas and the ground were measured using a tape measure. Hand-held data collectors were used to log raw data and display navigational information allowing surveyors to navigate survey lines spaced at 100- to 1000-m intervals along the beach. Profiles were surveyed from the landward edge of the study area...
Categories: Data;
Types: Map Service,
OGC WFS Layer,
OGC WMS Layer,
OGC WMS Service;
Tags: Bathymetry and Elevation,
CMHRP,
Clatsop County,
Coastal and Marine Hazards and Resources Program,
Columbia River,
This portion of the USGS data release presents bathymetry data collected during surveys performed in the Columbia River littoral cell, Washington and Oregon in 2020 (USGS Field Activity Number 2020-622-FA). Bathymetry data were collected using four personal watercraft (PWCs) equipped with single-beam sonar systems and global navigation satellite system (GNSS) receivers. The sonar systems consisted of an Odom Echotrac CV-100 single-beam echosounder and 200 kHz transducer with a 9-degree beam angle. Raw acoustic backscatter returns were digitized by the echosounder with a vertical resolution of 1.25 cm. Depths from the echosounders were computed using sound velocity profiles measured using a YSI CastAway CTD during...
Categories: Data;
Types: Map Service,
OGC WFS Layer,
OGC WMS Layer,
OGC WMS Service;
Tags: Bathymetry and Elevation,
CMHRP,
Clatsop County,
Coastal and Marine Hazards and Resources Program,
Columbia River,
This portion of the USGS data release presents bathymetry data collected during surveys performed in the Columbia River littoral cell, Washington and Oregon in 2016 (USGS Field Activity Number 2016-663-FA). Bathymetry data were collected using four personal watercraft (PWCs) equipped with single-beam sonar systems and global navigation satellite system (GNSS) receivers. The sonar systems consisted of an Odom Echotrac CV-100 single-beam echosounder and 200 kHz transducer with a 9 degree beam angle. Raw acoustic backscatter returns were digitized by the echosounder with a vertical resolution of 1.25 cm. Depths from the echosounders were computed using sound velocity profiles measured using a YSI CastAway CTD during...
Categories: Data;
Types: Map Service,
OGC WFS Layer,
OGC WMS Layer,
OGC WMS Service;
Tags: Bathymetry and Elevation,
CMHRP,
Clatsop County,
Coastal and Marine Hazards and Resources Program,
Columbia River,
This data release contains cyanotoxin concentrations for microcystins, cylindrospermopsins, anatoxins, and saxitoxins assessed using Enzyme-Linked Immunosorbent Assays (ELISA) on 363 samples collected from 82 surface-water sites located in the Cascade Range in Oregon, and eight sites located outside of the Oregon Cascade Range in Washington and California, during 2016-2020. Three sample types were assessed: 1) benthic colonies and mats of cyanobacteria (n=109), 2) plankton net tows (n=90), and 3) Solid Phase Adsorption Toxin Tracking samplers (SPATTs)(n=164).
Categories: Data;
Tags: Anderson Lake,
Aquatic Biology,
California,
Clackamas River,
Coast Fork Willamette River,
|

|
