Global Flood Hazard Frequency and Distribution is a 2.5 by 2.5 minute grid derived from a global listing of extreme flood events between 1985 and 2003 (poor or missing data in the early/mid 1990s) compiled by Dartmouth Flood Observatory and georeferenced to the nearest degree. The resultant flood frequency grid was then classified into 10 classes of approximately equal number of grid cells. The greater the grid cell value in the final data set, the higher the relative frequency of flood occurrence. The dataset is a result of the collaboration among the Center for Hazards and Risk Research (CHRR) , and the Columbia University Center for International Earth Science Information Network (CIESIN). If you wish to download this data, please [...]
Summary
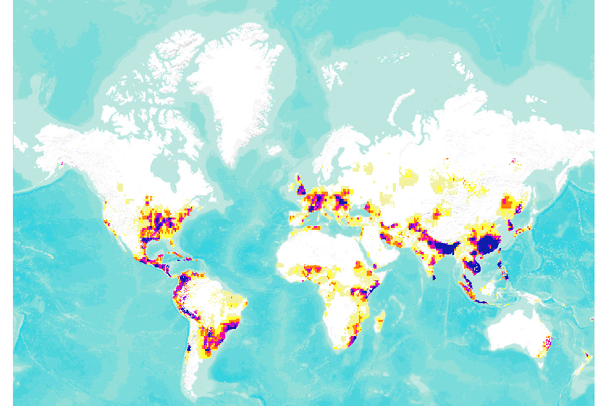
Global Flood Hazard Frequency and Distribution is a 2.5 by 2.5 minute grid derived from a global listing of extreme flood events between 1985 and 2003 (poor or missing data in the early/mid 1990s) compiled by Dartmouth Flood Observatory and georeferenced to the nearest degree. The resultant flood frequency grid was then classified into 10 classes of approximately equal number of grid cells. The greater the grid cell value in the final data set, the higher the relative frequency of flood occurrence. The dataset is a result of the collaboration among the Center for Hazards and Risk Research (CHRR) , and the Columbia University Center for International Earth Science Information Network (CIESIN).