This dataset was extracted from the terrestrial ecosystems of South America dataset.
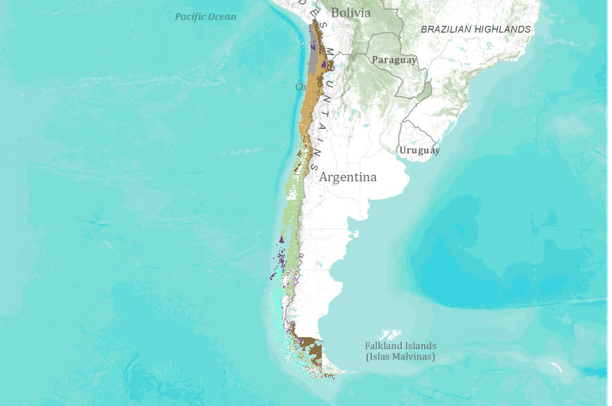
South America:
This dataset represents Ecological System patches using various reference datasets. Original data generarated from 2000 era data, modeled in 2005 and updated in 2008 and 2010.Originally, this project developed a GIS modeling approach, using a variety of abiotic and biotic data sets, to produce a map of the distribution of Latin America and Caribbean (LAC) ecological systems throughout South America for use in ecoregional assessments.
Ecological systems, defined as spatially co-occuring assemblages of vegetation types sharing a common underlying substrate, ecological process, or gradient, were identified for all of LAC in a recent classification effort by NatureServe (Josse et. al., 2003), but the on-the-ground occurrences of these targets had not yet been mapped. Good maps showing the number and location of target occurrences underpin The Nature Conservancy's goal setting, target assessment, portfolio assembly, and subsequent monitoring efforts.This dataset is a polygon shapefile of modeled ecological systems that occur within South America.
Five input data layers - elevation (SRTM, 2000), landform (SRTM, 2000 and WWF-Hydrosheds, 2005), geology (TNC and GDS, 2005), landcover (GLC, 2000) and bioclimate (WorldClim, 2004 and TNC, 2005) - were combined to produce a map of unique ecological system footprint gridcodes. These gridcodes were then evaluated and attributed to one of NatureServe's Latin America and Caribbean Ecological Systems.
Central America:
Using the terrestrial ecosystem map produced by the World Bank and CCAD in 2000, The Nature Conservancy and NatureServe, crosswalked the aforementioned ecosystem classification with the NatureServe standard classification for Latin America and the Caribbean (2003). The purpose of this map is to have a consistent ecosystem map for Latin America, as South America has an ecosystem map using the NatureServe classification since 2005. The ecosystem crosswalk was done by Maarten Kappelle, Lenin Corrales, Carmen Josse and Leonardo Sotomayor, and was completed in June 2010. The crosswalk was done in several parts.
First, the entire World Bank ecosystem classification attributes and description was added to a IABIN standard ecosystem classification database. The components of the ecosystem classification were thus broken down into variables such as substrate, geology, elevation ranges, dominant species, among other components.
Second, this database was added to the IABIN ecosystem database which contains other classifications such as the NatureServe classification in its original componets or building blocks.
Third, an ecosystem translator was used to match the components of ecosystems in the World Bank classification with the ecosystem components of the NatureServe classification. This process matched ecosystems that were likely to be the similar in each classification. Using the similarity ratio produced by the translator and the description of the ecoystems, the classifications were matched.
Fourth, the crosswalked classification was reviewed by experts at TNC and NatureServe and approved.
Fifth, a map was produced witht he crosswalk and the map was peer reviewed by the same experts. Final recommendations were made and changes were made in ecosystem occurrances that were obviously out of place. These recommendations were incorporated and this map is the final product of these changes.